
The stock and the bond markets are the most efficient places to invest your savings. Owning stocks means owning pieces of businesses while owning bonds means becoming a lender to the same businesses or sometimes to the governments.
In case a business goes bankrupt, the bondholders get paid first before the stockholders get anything. But in exchange for that apparent safety, you give up on returns, a lot of returns.
Interest payments on bonds are fixed and hence more predictable than dividends from stocks, another reason for the lower perceived risk with bonds than with stocks. And lower perceived risk means lower expected returns.
The price of a stock depends upon the level of current and future dividends and then you must discount those dividends at some discount rate to arrive at fair value. Everyone has different interpretations of these numbers and their collective opinions, including of those who participate to just gamble like it is some sort of a casino, gets reflected in the prices we see quoted each day. All this means that stock prices are volatile and will remain volatile.
Dividends from small company stocks are more unreliable (riskier) than from large company stocks and hence are even more volatile than just stocks as a category. So, more risk should equal more reward, but we shall see.
I’ve got monthly returns data for three categories of investments going back to January of 1987.
- Bonds and specifically, long-term Treasury bonds. By buying these bonds, you are lending money to the Federal government for a decade long timeframe. And since the Federal government cannot go bankrupt, this is as risk-free of an investment as it can get, assuming you hold on to it till it matures.
- LargeCapStocks or large company stocks. By owning them, you own little pieces of some of the biggest businesses in America.
- SmallCapStocks or small company stocks. These businesses are nimble. They can grow fast. They can also fail easily. The risk is high, and you want to get compensated for taking on that risk. So, the expected returns should be high. Finance textbooks tell us that.
And this is how the three investments behaved.
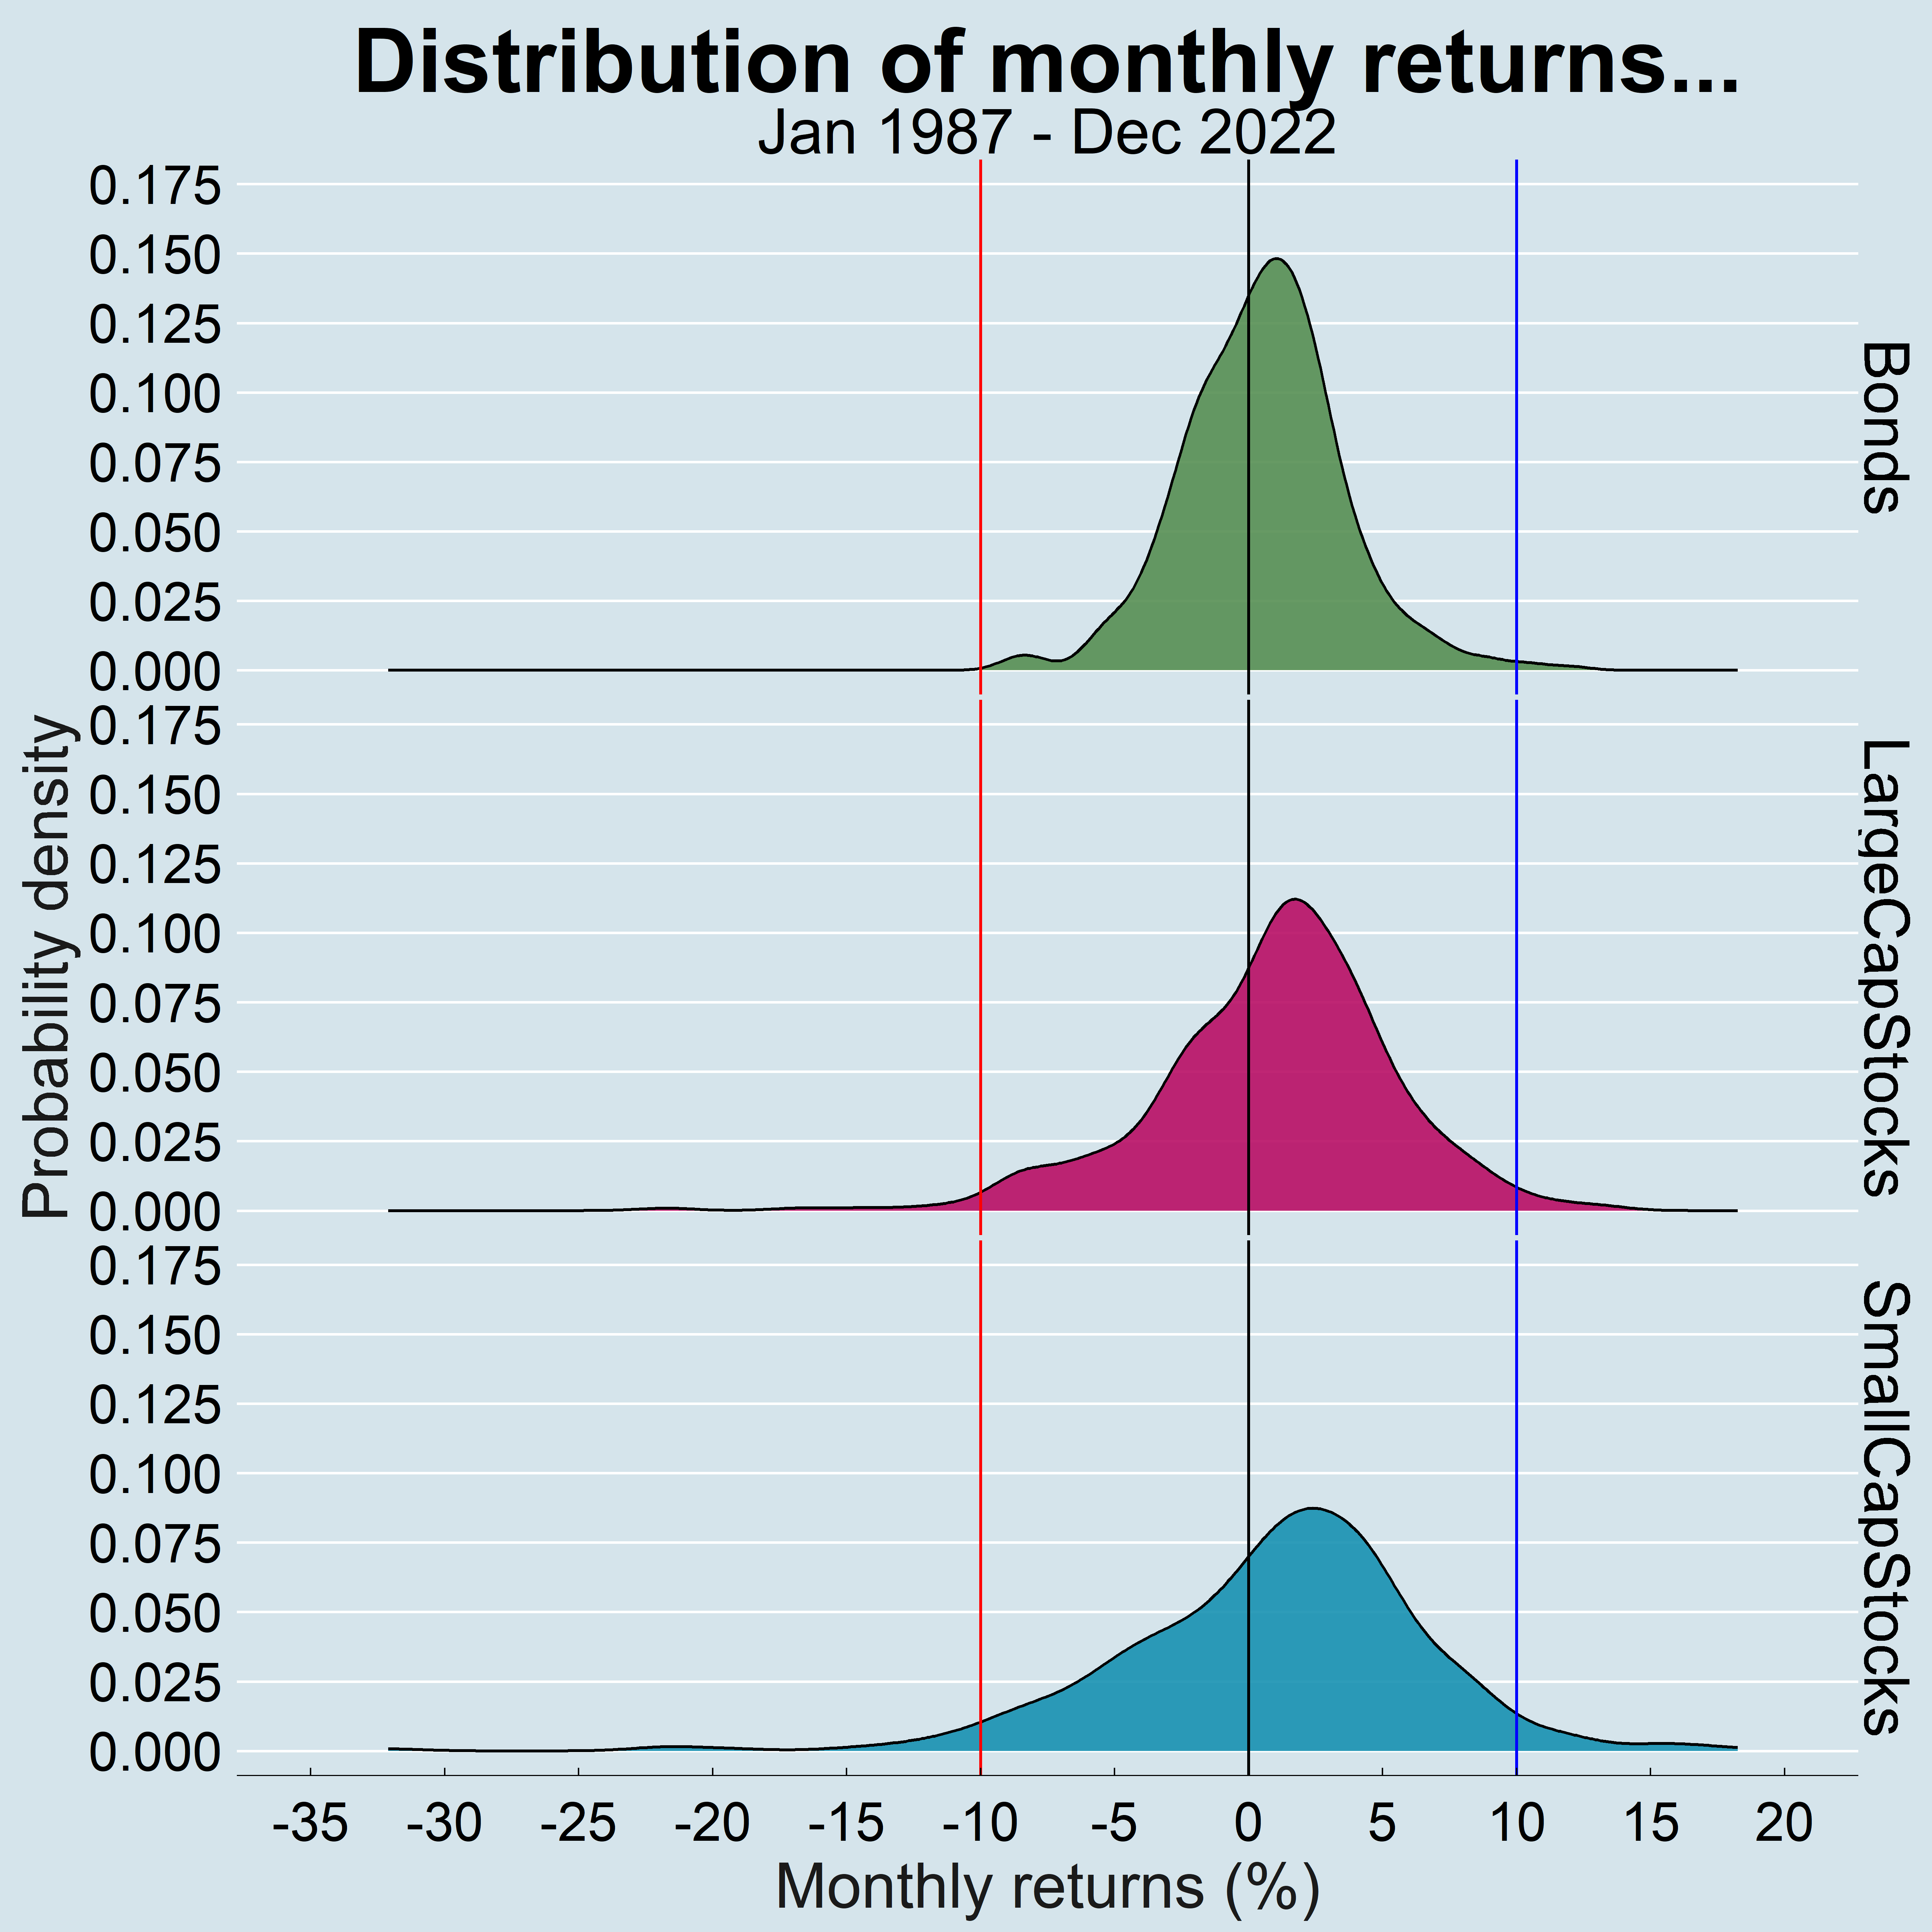
Probability density tells us the proportion of months out of the total months where returns varied between any two ranges. Take the sub-plot for bonds for example. We can state by eyeballing it that for about 60 percent of the months, the monthly returns were between zero and 10 percent. In fact, we can make that claim for all three categories of investment.
I show three vertical lines for each sub-plot: at zero percent in black, at -10 percent in red and at +10 percent in blue. A few observations…
- You know that if you bought and held any of these investments from the start of the period to the end, you made money. And in some cases, a good chunk of money. How do we know that without doing any number-crunching? By estimating the area under the curves for each investment that fall to the right of the black dividing line that marks the zero percent line. The area under the curve for each one of them is greater to the right of that line than to the left. That means that at any given time, your returns were more positive than negative and that compounding over months and years is what gets you to that good chunk of money.
- As you go down the plot from bonds to small cap stocks, the distribution of returns gets wider and flatter. Bonds have the tightest distribution; small cap stocks have the widest and flattest distribution. What does that mean? An increasing level of volatility as the distribution gets flatter. Some use volatility and risk interchangeably but volatility is not really risk as broad-based asset classes don’t go to zero. That is not true with individual securities. Bonds have the tightest distribution which in statistical terms means the smallest standard deviation (volatility). Small cap stocks, on the other hand, have the widest distribution and hence are considerably more volatile than bonds.
- It is not as apparent but if you were to observe the peaks to the right of the zero-marker black line for each sub-plot, the peaks drift a little farther away from that line for stocks as compared to that for bonds. That implies that on average, monthly returns for stocks were higher than for bonds. Again, nothing pathbreaking, just one more observation.
Most mistakes happen in the tails…
Then there are those long tails and specifically the left tails below the -10 percent line. The tails are visible for stocks but not noticeably visible for bonds. So, zooming in…
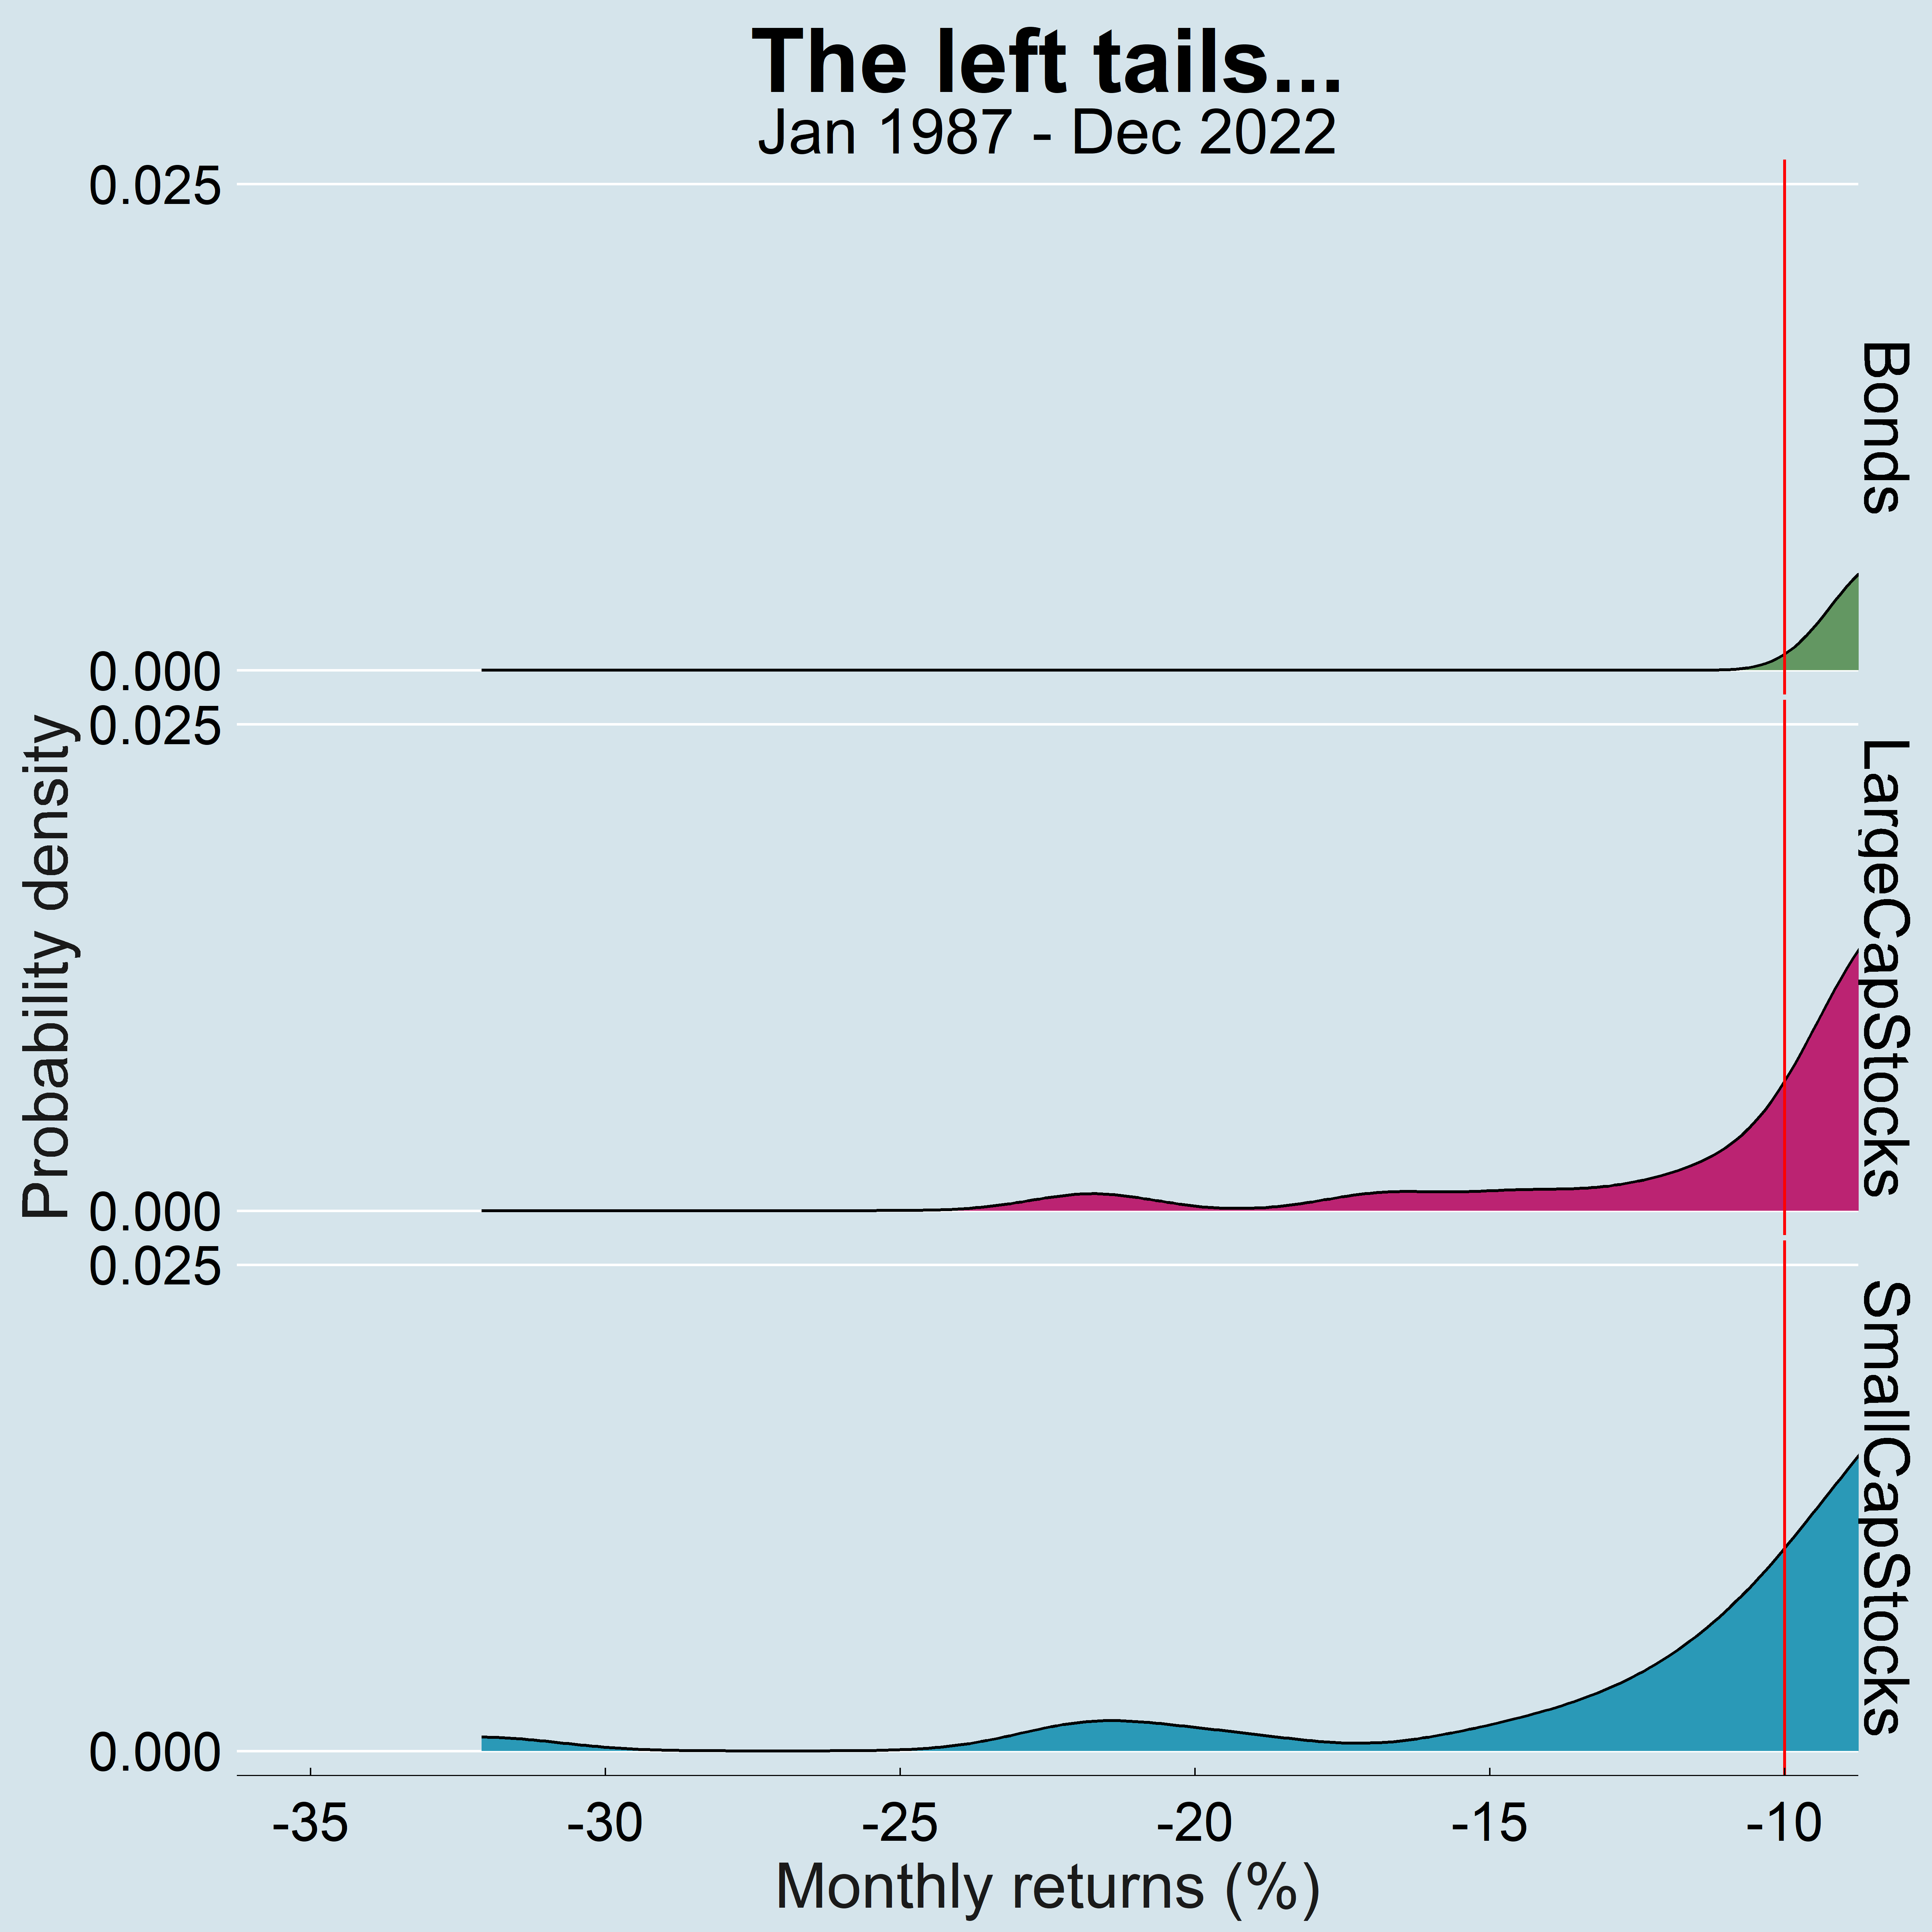
Bonds had virtually no instance where you suffered a monthly decline of more than 10 percent.
That is not true for stocks. Of all the months (432 in total), you’d have to endure a monthly decline of more than 10 percent for large cap stocks six different times.
The worst monthly decline for large cap stocks was -22% in 1987. For those who know, that month includes the ominous Black Monday. The rest of the “bad” months happened during major market panics caused by events like the Asian financial crisis, the Dot-com tech crash, the banking crisis of 2008 and of course, the Covid pandemic.
These “bad” events are what forms the left-tails in the plot above. And that is where the gravest of all mistakes happens. No one panic sells during the right-tail months, also called the “good” months.
But if you have a plan and a conviction to act, the “bad” months in fact are the best months to invest new money. And the “good” months quite naturally are the worst. You are buying future cash flows (dividends). You should be euphoric when you get to buy the same amount of cash flows at 20 and 30 percent discounts.
Bull markets begin with the feeling that the market can only go lower. Bear markets begin with the feeling that the market can only go higher.
Peter Atwater
Back to the data, things get a bit wilder with small company stocks where you’d have to endure 14 separate monthly declines of more than 10 percent. That is more than double the number of months for large cap stocks. There was even a month in the year 1987 when small company stocks declined by a good 32 percent. That is in a single month. Imagine waking up a month later with a third less money?
The natural question then is that you’d have made more money investing in small cap stocks, right?
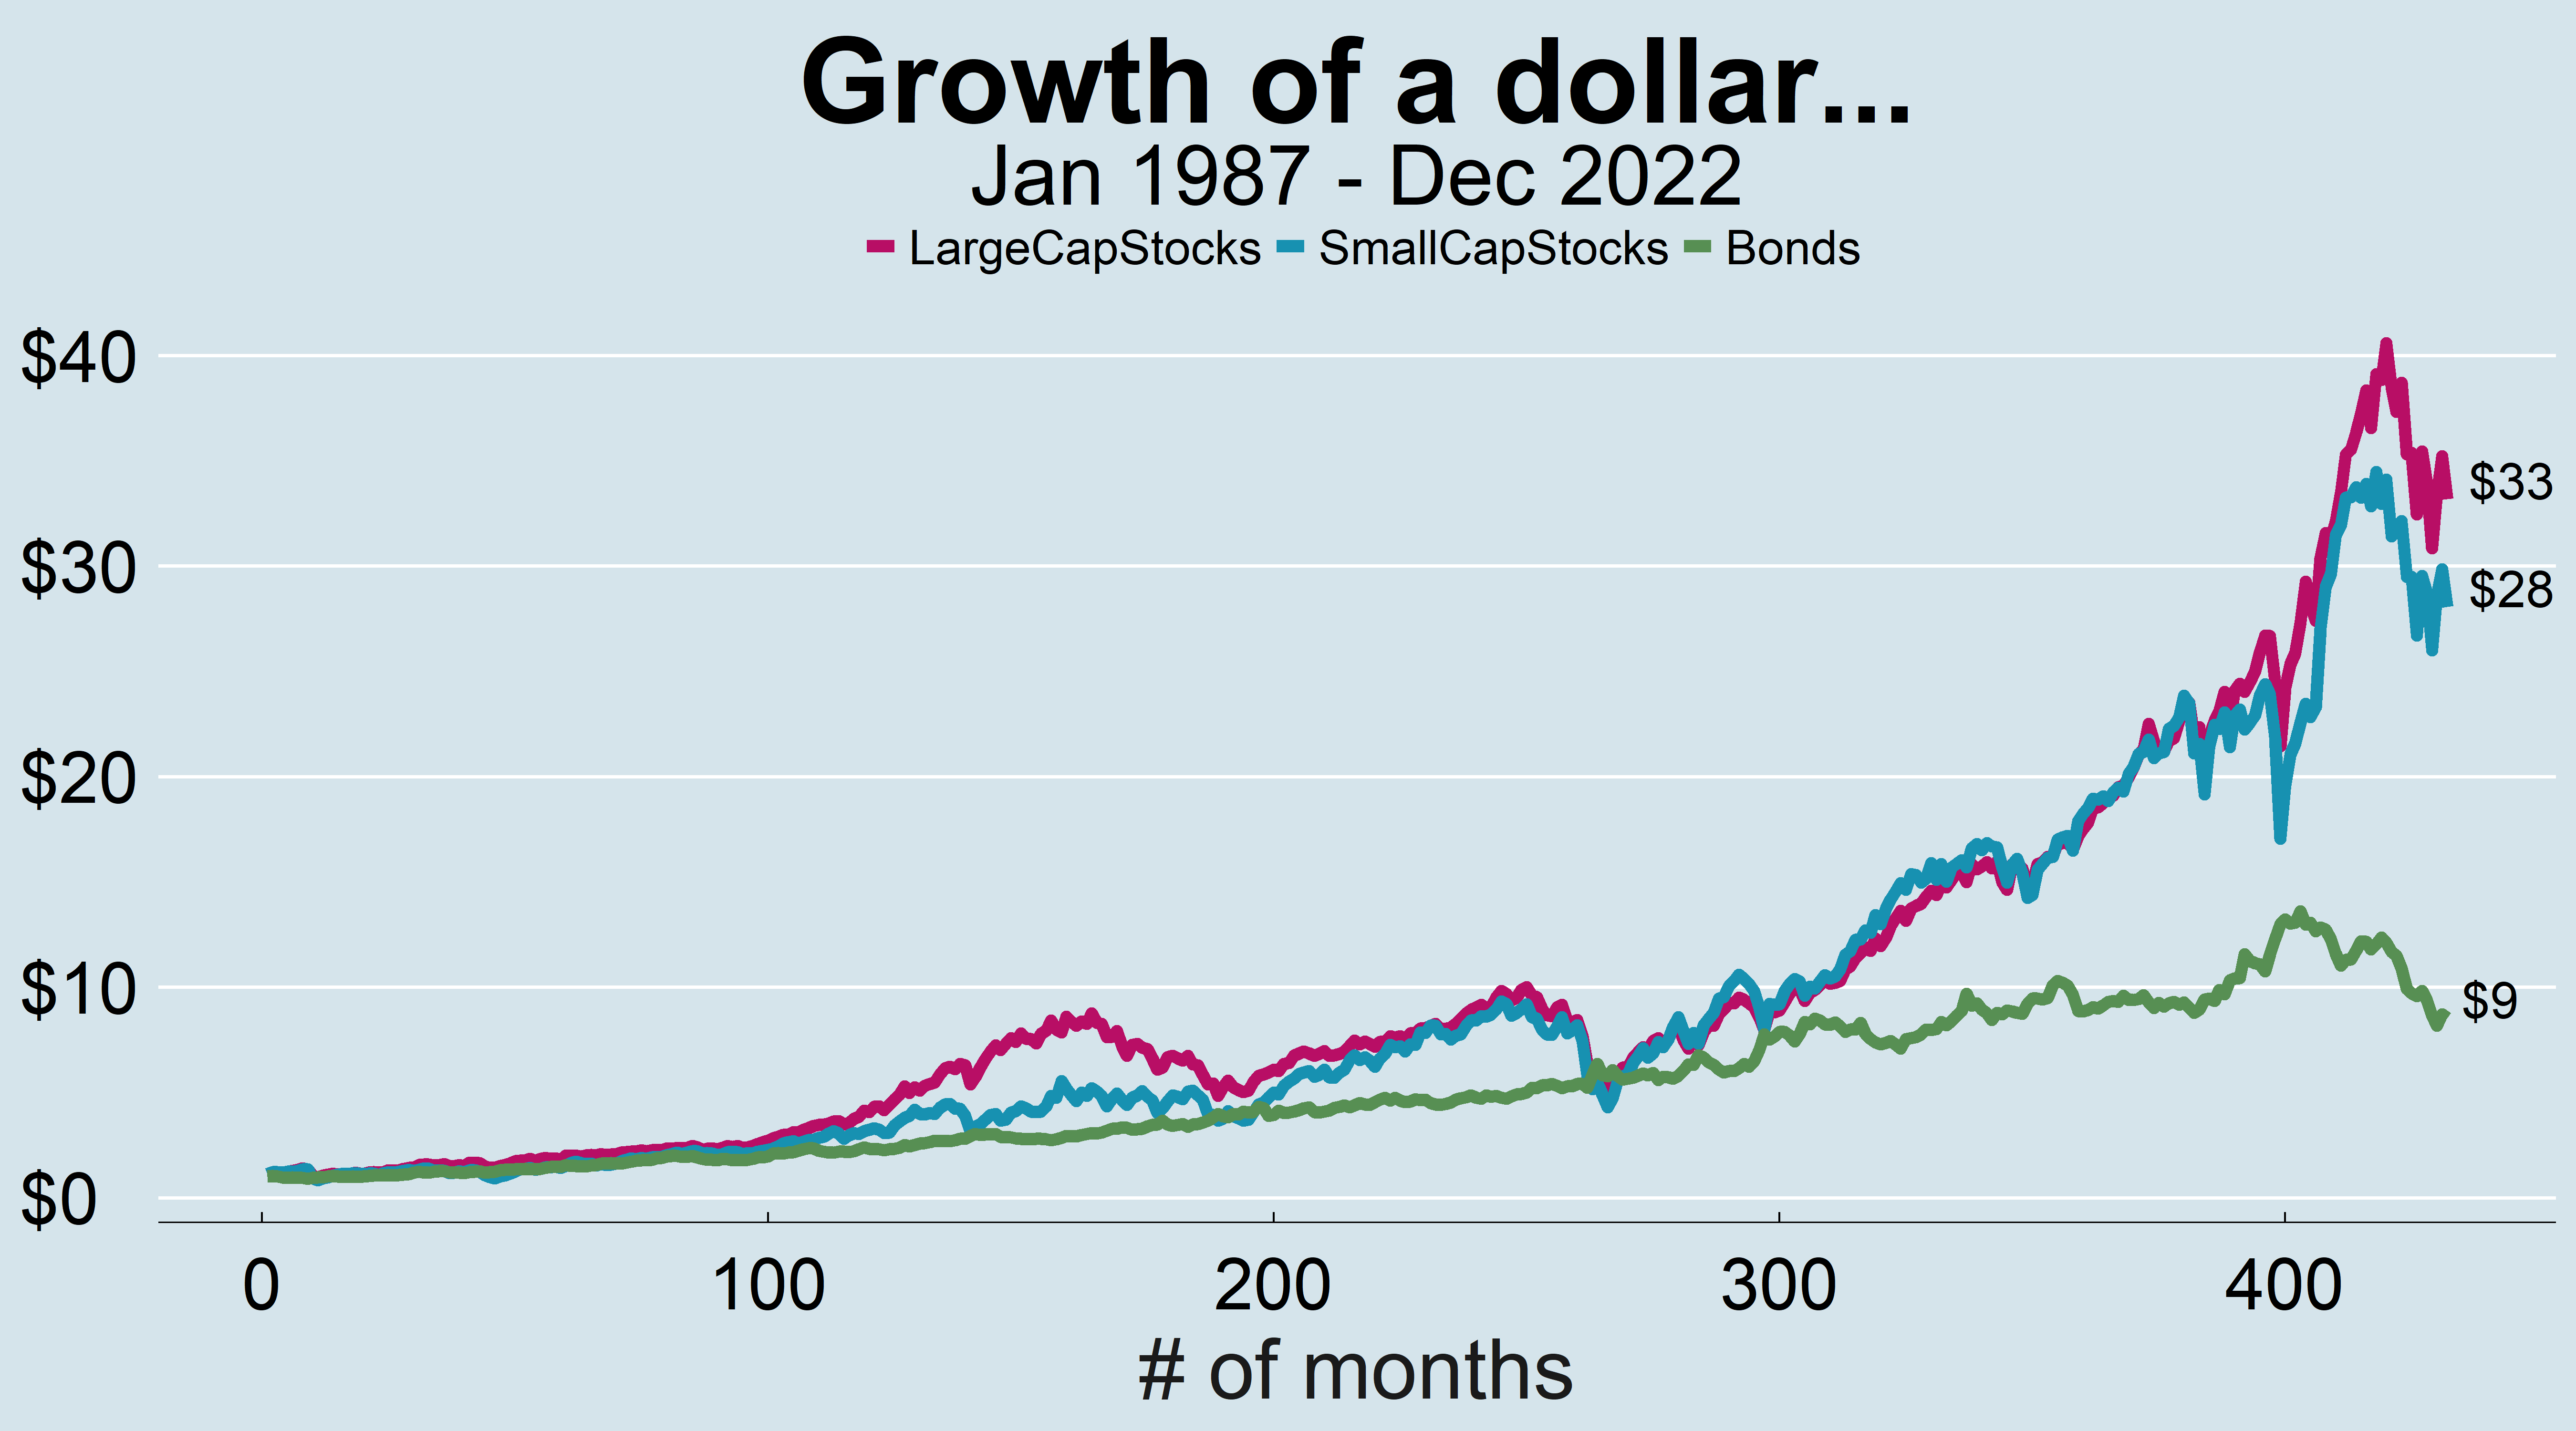
Well, no. You made more money in stocks than bonds and that was expected. But you made less money with small cap stocks than with large cap stocks. That is even after taking all that risk. Isn’t that interesting?
So, does that mean we abandon small cap stocks? No. What this means is that we don’t have a way to predict what an investment will do in any given cycle. And we don’t know when those cycles will turn. We just have to wait for them to turn.
This discussion as always comes down to the process. If you have the right process built around a good financial plan, you just have to accept the occasional vicissitudes of the markets and invest away.
Thank you for your time.
Cover image credit – Anete Lusina, Pexels