I get to listen to radio sometimes and there are (unfortunately) still a plethora of shows out there where people call in to ask whether a given stock is a buy, sell or a hold.
So think about this. You call into a radio show to talk to a complete stranger – okay, a professional stranger – who knows nothing about you, doesn’t know your circumstances, doesn’t know about your work, about your family, doesn’t know what other things you own or how a particular investment fits into your overall pie and what else are you doing with the rest of your money, whether you are afloat or drowning in debt – none of those things.
And yet you ask him (always a him) whether you should buy, sell or hold a stock? Crazy I say but this is how many invest.
So there is this person who hosts this radio show where people call in for what I deem non-contextual advice but in an attempt to sound relevant, will throw out terms like stochastic indicator this and Bollinger Bands that, moving average this and sideways trend that. Lots of fancy terms that some consider investing but has nothing to do with the real business of investing.
And all that word magic is what they call technical analysis. It’s about identifying patterns in past stock prices and using them to predict future prices. That is to say that profits don’t matter, interest rates don’t matter, valuations don’t matter, long-term sustainability of a business don’t matter. The only thing that matters are the zigs and zags in stock prices and profiting from it, if that was ever possible.
But we know technical analysis is dumb. Anyone who gives any credence to anything that has technical analysis in anything they say, their entire premise is dumb.
And a quick search will lead us to countless studies that prove that it is dumb.
And I bet the host of that show deep down knows that it is dumb. But then he’s got an audience to serve.
Technical analysis is what I would call making investing decisions based on data without theory. Just look at the time-series data for a stock, concoct some smart-sounding theory around it and call it something technical.
If what transpires deviates from what was predicted, concoct a new theory, and call it something else. And it must sound technical of course.
Talk about concocting a theory, Tyler Vigen runs a site called Spurious Correlations that attempts to fit all sorts of totally unrelated data series to each other. Like say the number of people who died from getting entangled in their own bedsheets versus say the amount of per capita cheese consumption.
And with correlation coefficient between the two totally unrelated data series approaching 0.95 means that if you want to save people from their own bedsheets, make sure they don’t eat cheese. That’s technical analysis in a nutshell.
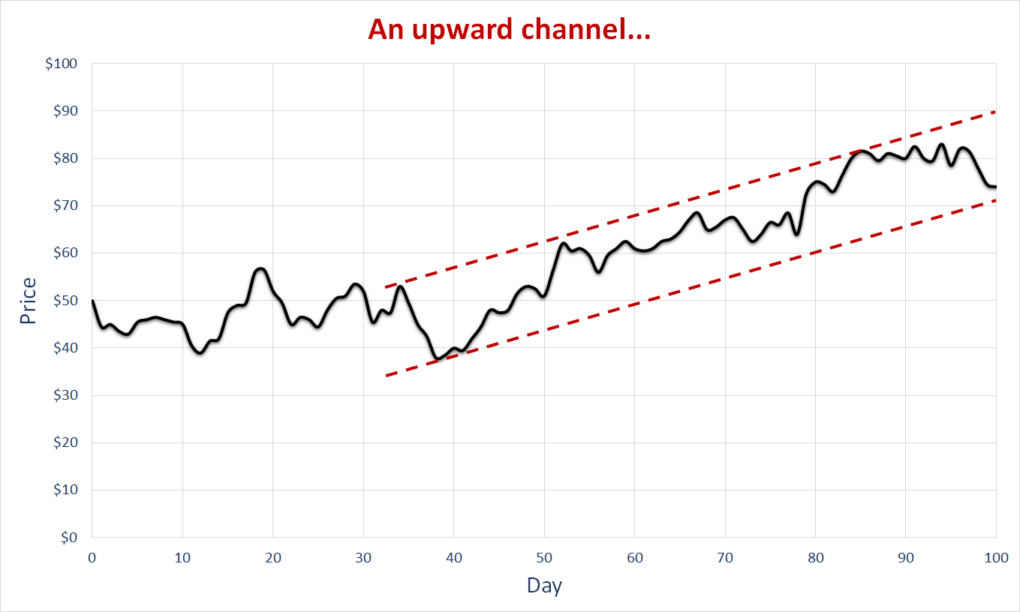
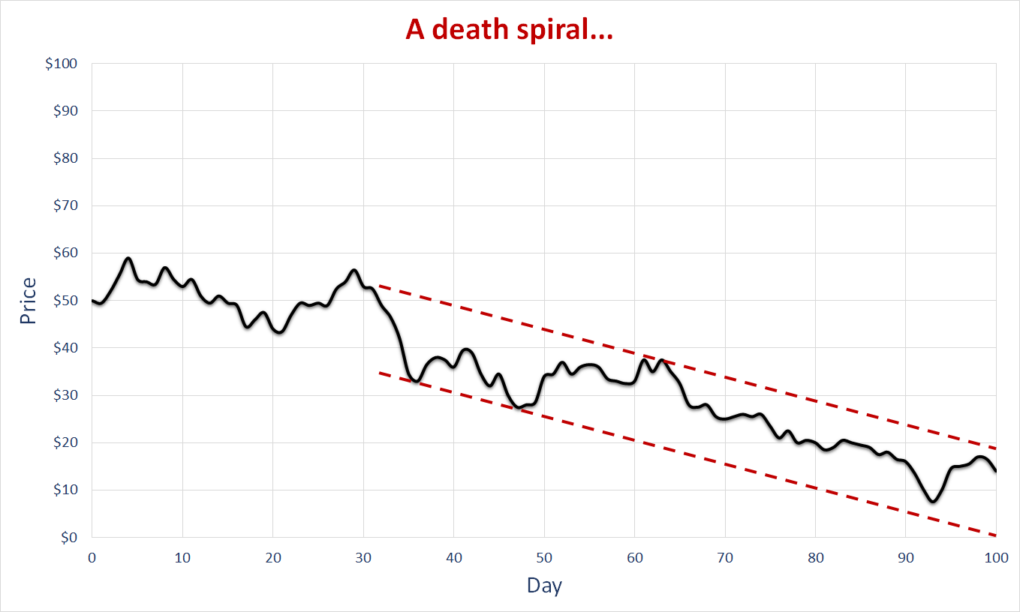
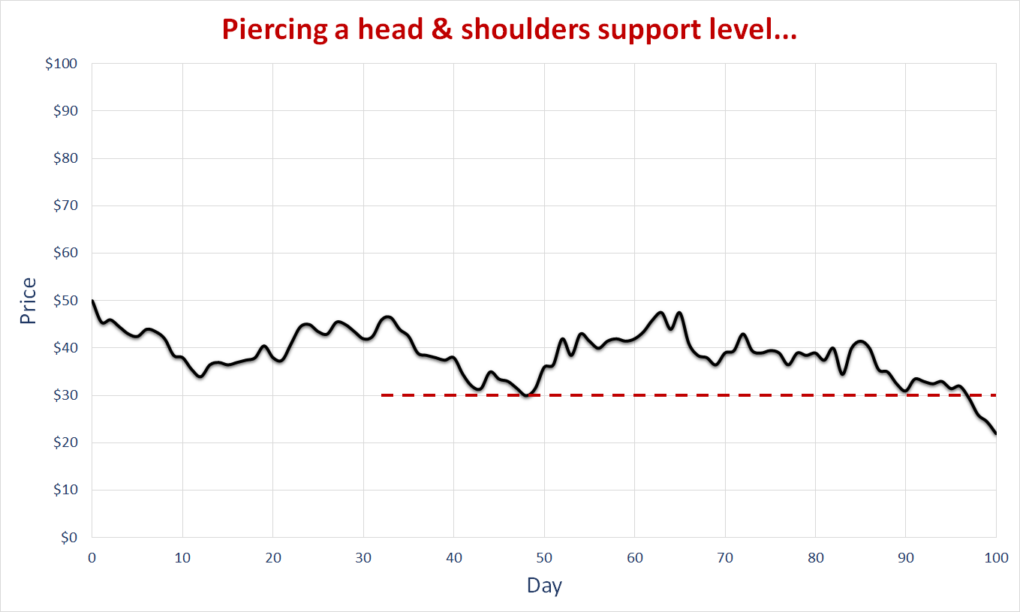
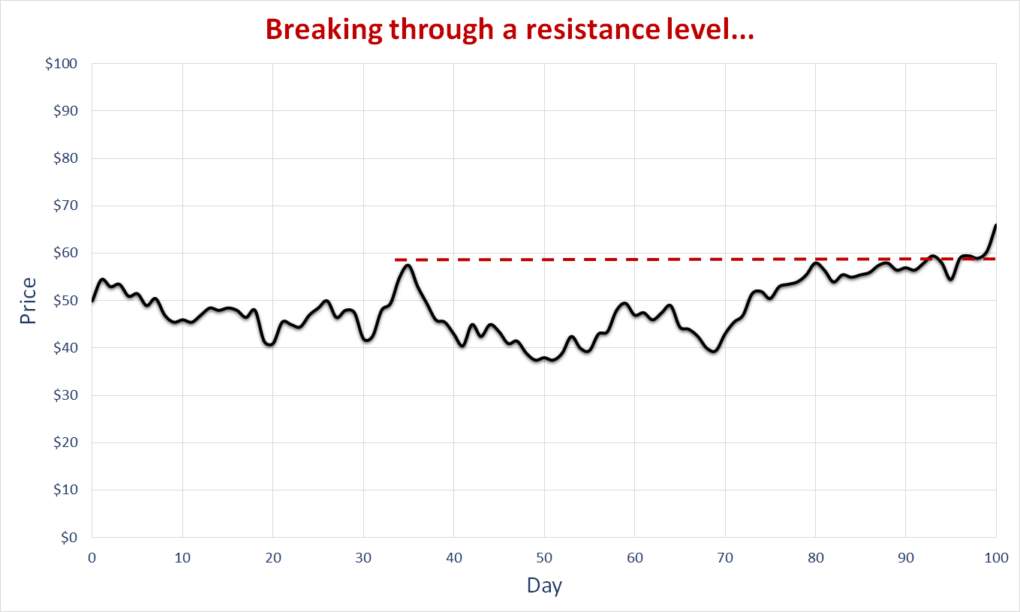
Gary Smith in his book, Standard Deviations continues with the fun by generating some stock price charts for a fictional company whose stock price starts at $50 and then each day, the price changes based upon the outcomes of 25 consecutive coin flips. If the coin lands a head, the price goes up fifty cents and if it lands a tail, the price goes down by 50 cents.
So out of the 25 consecutive coin flips, if fourteen landed heads and eleven landed tails, the stock price would rise by $1.50 the next day.
And I bet if these charts were to be shown to that person on the radio show, he would get all technical and say terms like…
And quite naturally, if the stock price is trending upwards, it would continue to trend upward to the moon and beyond so buy, buy, buy.
Or if you get a chart like below, a death spiral, you never want to go near it because this is where your money goes to die.
This chart below had a strong support at $30 and then it was pierced. And we know once that support is pierced, it’s all over.
Or the one below that shows clear resistance at $58 but now that the stock price has broken through that impregnable resistance, it’s again all the way to the moon and beyond.
We know how silly all this sounds. But it stops being silly once we find out how much money is transacted each day based upon all this silliness.
Thank you for your time.
Cover image credit – Katie, Pexels


