Author: OnceUSave

  • Investing Your Retirement Savings

    Investing Your Retirement Savings

    Johnny Depp was once the highest paid actor with a net worth of $650 million1. In 2017, he filed a lawsuit against his business managers accusing them of stealing all his wealth and leaving him penniless.

    His managers countersued claiming that Depp spent $2 million a month maintaining his lavish lifestyle that included spending $500,000 on rental warehouses, $200,000 on private jets and $3,000 a month on wine2.

    No amount of money is enough when the expense side of the equation remains out of whack. And this is not the only story.

    Back to the real world, say $50,000 is all you’ll spend each year in retirement. Income from Social Security is on top of that. And say you have got $2.5 million saved up. Is there a reason you should own anything but stocks?

    Standard retirement planning advice states that as you get closer to retirement, you should own less stocks and more bonds because stocks are risky. That is how most target date funds work.

    And with a less risky portfolio with bonds mixed in, you can confidently withdraw money from your accounts without ever running out.

    A 4% safe withdrawal rate has become the gold standard which means if you save up to 25 times your expenses (1/0.04 = 25), you are done.

    Dividend yield on stocks these days is 2% so clearly, an all-stocks portfolio will run the risk of running out of money at a 4% withdrawal rate. Stocks are volatile and when you draw income from an all-stocks portfolio when they decline in price which they do from time to time, you won’t have much stocks left when their prices eventually recover.

    Hence you mix in bonds that yield (interest income) more than stocks (dividends) to smooth out the ride.

    But anytime you add bonds, you give up on growth, so you’ll end up with less when you are no longer around…if that matters to you. And you end up with less money when you add bonds to a portfolio because interest income from bonds is a cost to a business issuing those bonds. That business hence needs to earn more than its input costs or else it goes extinct.

    The simplest way to think about it is with how the banking system works. Banks are in the business of lending money. They take our deposits and pay us interest. They then turn around and loan our deposits to borrowers at a higher interest rate than they pay us.

    And if they don’t earn more than the interest they pay us, they cease to exist. The same logic applies to businesses who go out in the bond market and borrow money. If they don’t out-earn their interest expense, they cease to exist. Hence, it is structural for stocks to outperform bonds in the long run.

    But say you have designed your happy life on $50,000 a year after accounting for income from Social Security and you have got $2.5 million in savings, do you then ever need to own bonds?

    You don’t because $50,000 is 2% of $2.5 million that you can safely expect as dividends each year from an all-stocks portfolio.

    Plus, dividends grow over time. In fact, the growth rate on dividends is designed to exceed inflation. Dividends are a portion of the profits that come back to you as a shareholder of the businesses you own and businesses are not in the business of losing money.

    So, when input costs for a business rise due to inflation, it has two choices – either absorb those costs without raising prices for the stuff they sell and slowly wither away or pass down those costs to their end customers while preserving their profit margins.

    Businesses in aggregate tend to do the latter and hence dividends continuing to outpace inflation in the long run makes sense. And the data proves that3.

    But an all-stocks portfolio is going to be way more volatile than a balanced mix of stocks and bonds but that only matters if you make it matter.

    Risk and return are inextricably intertwined. In almost every country where economists have studied securities returns, stocks have had higher returns than bonds. Further, if you want those high stock returns, you are going to have to pay for them by bearing risk; this is a polite way of saying that in the course of earning those higher returns, your portfolio is going to lose a truckload of money from time to time. Conversely, if you desire perfect safety, then resign yourself to low returns. It really cannot be any other way.

    William Bernstein

    But what about real estate? First, you’ve got plenty exposure to real estate if you own a home.

    Second, by being owners of corporations that make up the stock market, you already have a sizable implicit exposure to real estate through real estate investment trusts and through direct ownership of physical real estate these corporations own. Take McDonald’s for example. A fifth of its market value is derived from the physical ownership of real estate that it leases to its franchises.

    And last, just like interest on bonds, the rent or the mortgage you pay is also an indirect cost to the businesses you own through the stock market. The company has to pay you enough in your paychecks to enable you to live wherever the company decides to create that next job and still clear profits.

    If it cannot, it will not be creating that job which then reduces demand for real estate and eventually denting their prices.

    So back to drawing income from your savings, if the size of your savings can help you sustain on a 2% withdrawal rate, you can choose to own an all-stocks portfolio and depart this planet with lasting generational wealth.

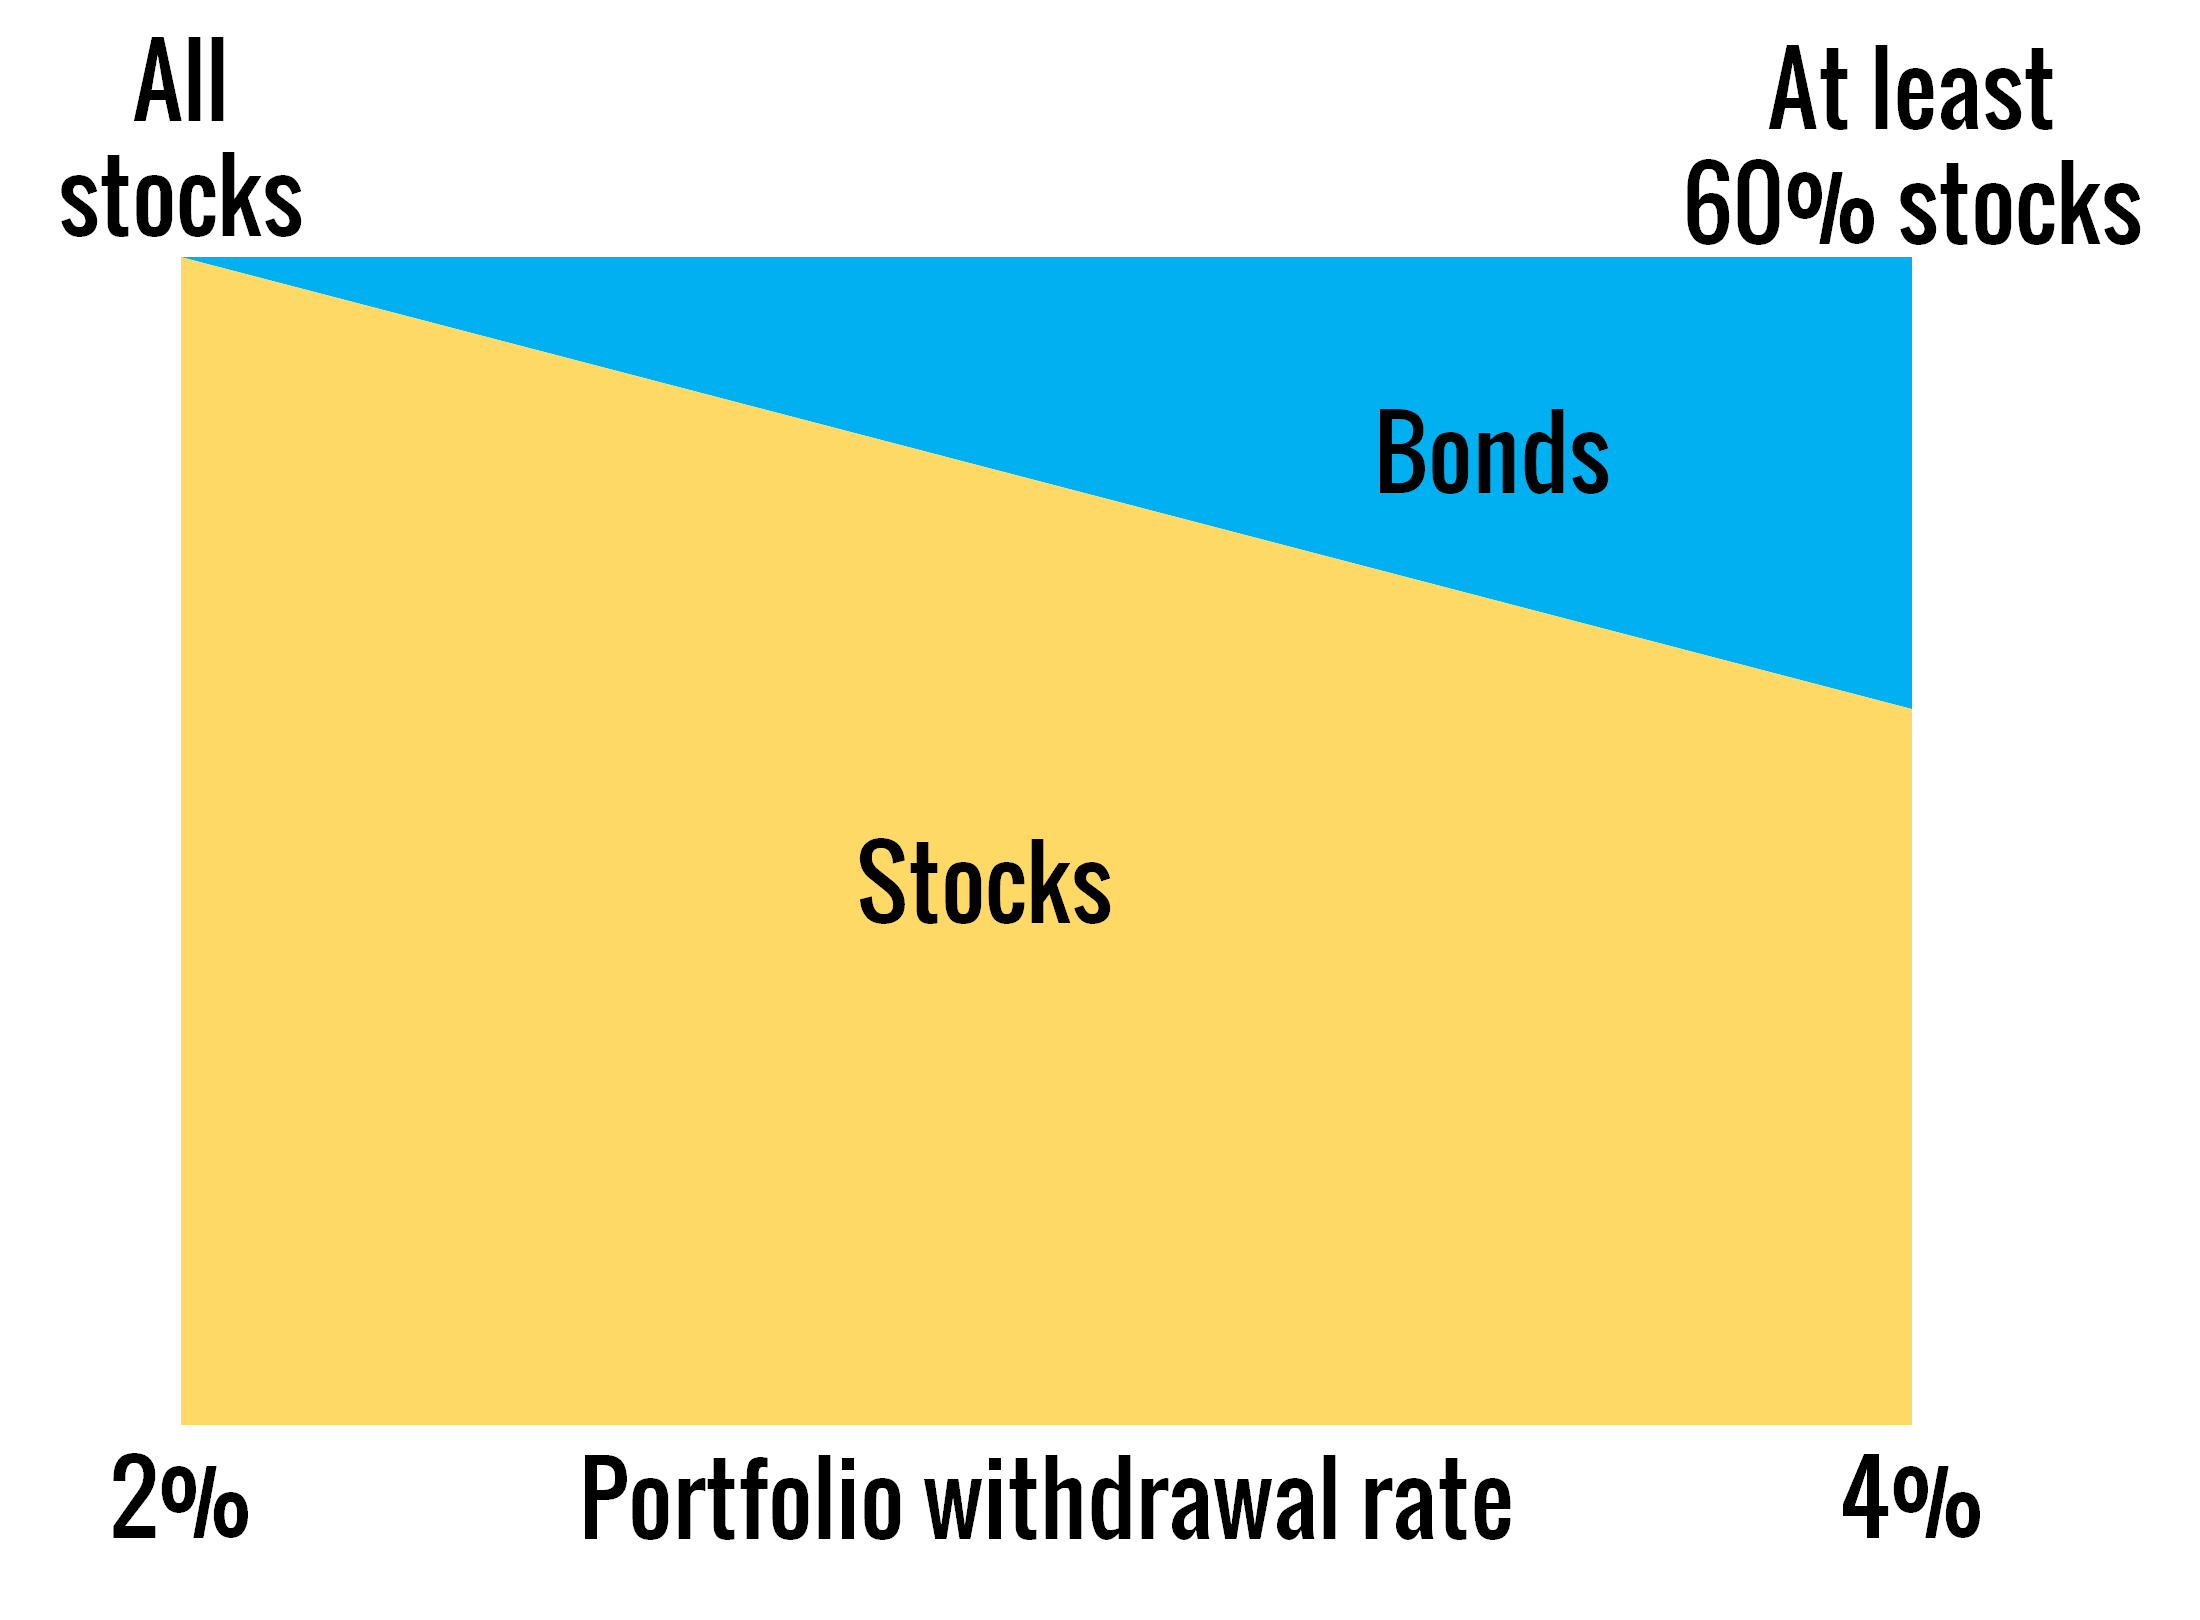
    But if you need more income, then you’ll need to own bonds. Income from Social Security is like owning an inflation-indexed annuity (guaranteed income for life) so I wouldn’t go overboard with bonds. The guideline below is what I recommend and of course, it varies based on individual circumstances.
    In short, if you are rich, you are set 🙂 – rich not just in terms of having great possessions but rich in terms of having fewer wants.

    Thank you for your time.

    Cover image credit – Tima Miroshnichenko

    Stephen Rodrick. “The Trouble With Johnny Depp“, MarketWatch. June 21, 2018.

    Eriq Gardner. “Johnny Depp Settles Blockbuster Lawsuit Against Business Managers“, The Hollywood Reporter. July 16, 2018.

    Mark Hulbert. “You need to pay more attention to dividends — this math shows why they beat inflation“, MarketWatch. April 23, 2022.

  • Never Too Late

    Never Too Late

    You know the end of working for a paycheck is coming but when you are in your 20s, that end seems so far that it might not as well come. Plus, life has a way of getting in the way.

    But then you wake up one day when you are 45 and you start to get stressed. So, here is a plan to get de-stressed.

    The first thing you’d want to know is how much of your pre-retirement paycheck needs replacing. You won’t need the whole thing because most life expenses will be done by the time you retire. Expenses like…

    • Income taxes
    • Mortgage payments
    • Paying for college
    • Saving for retirement (yes, that was an expense while you were working)

    Plus, you’ll have income from Social Security which regardless of what you hear, is going to be there.

    So, say that plus $50,000 a year in income is all you need.

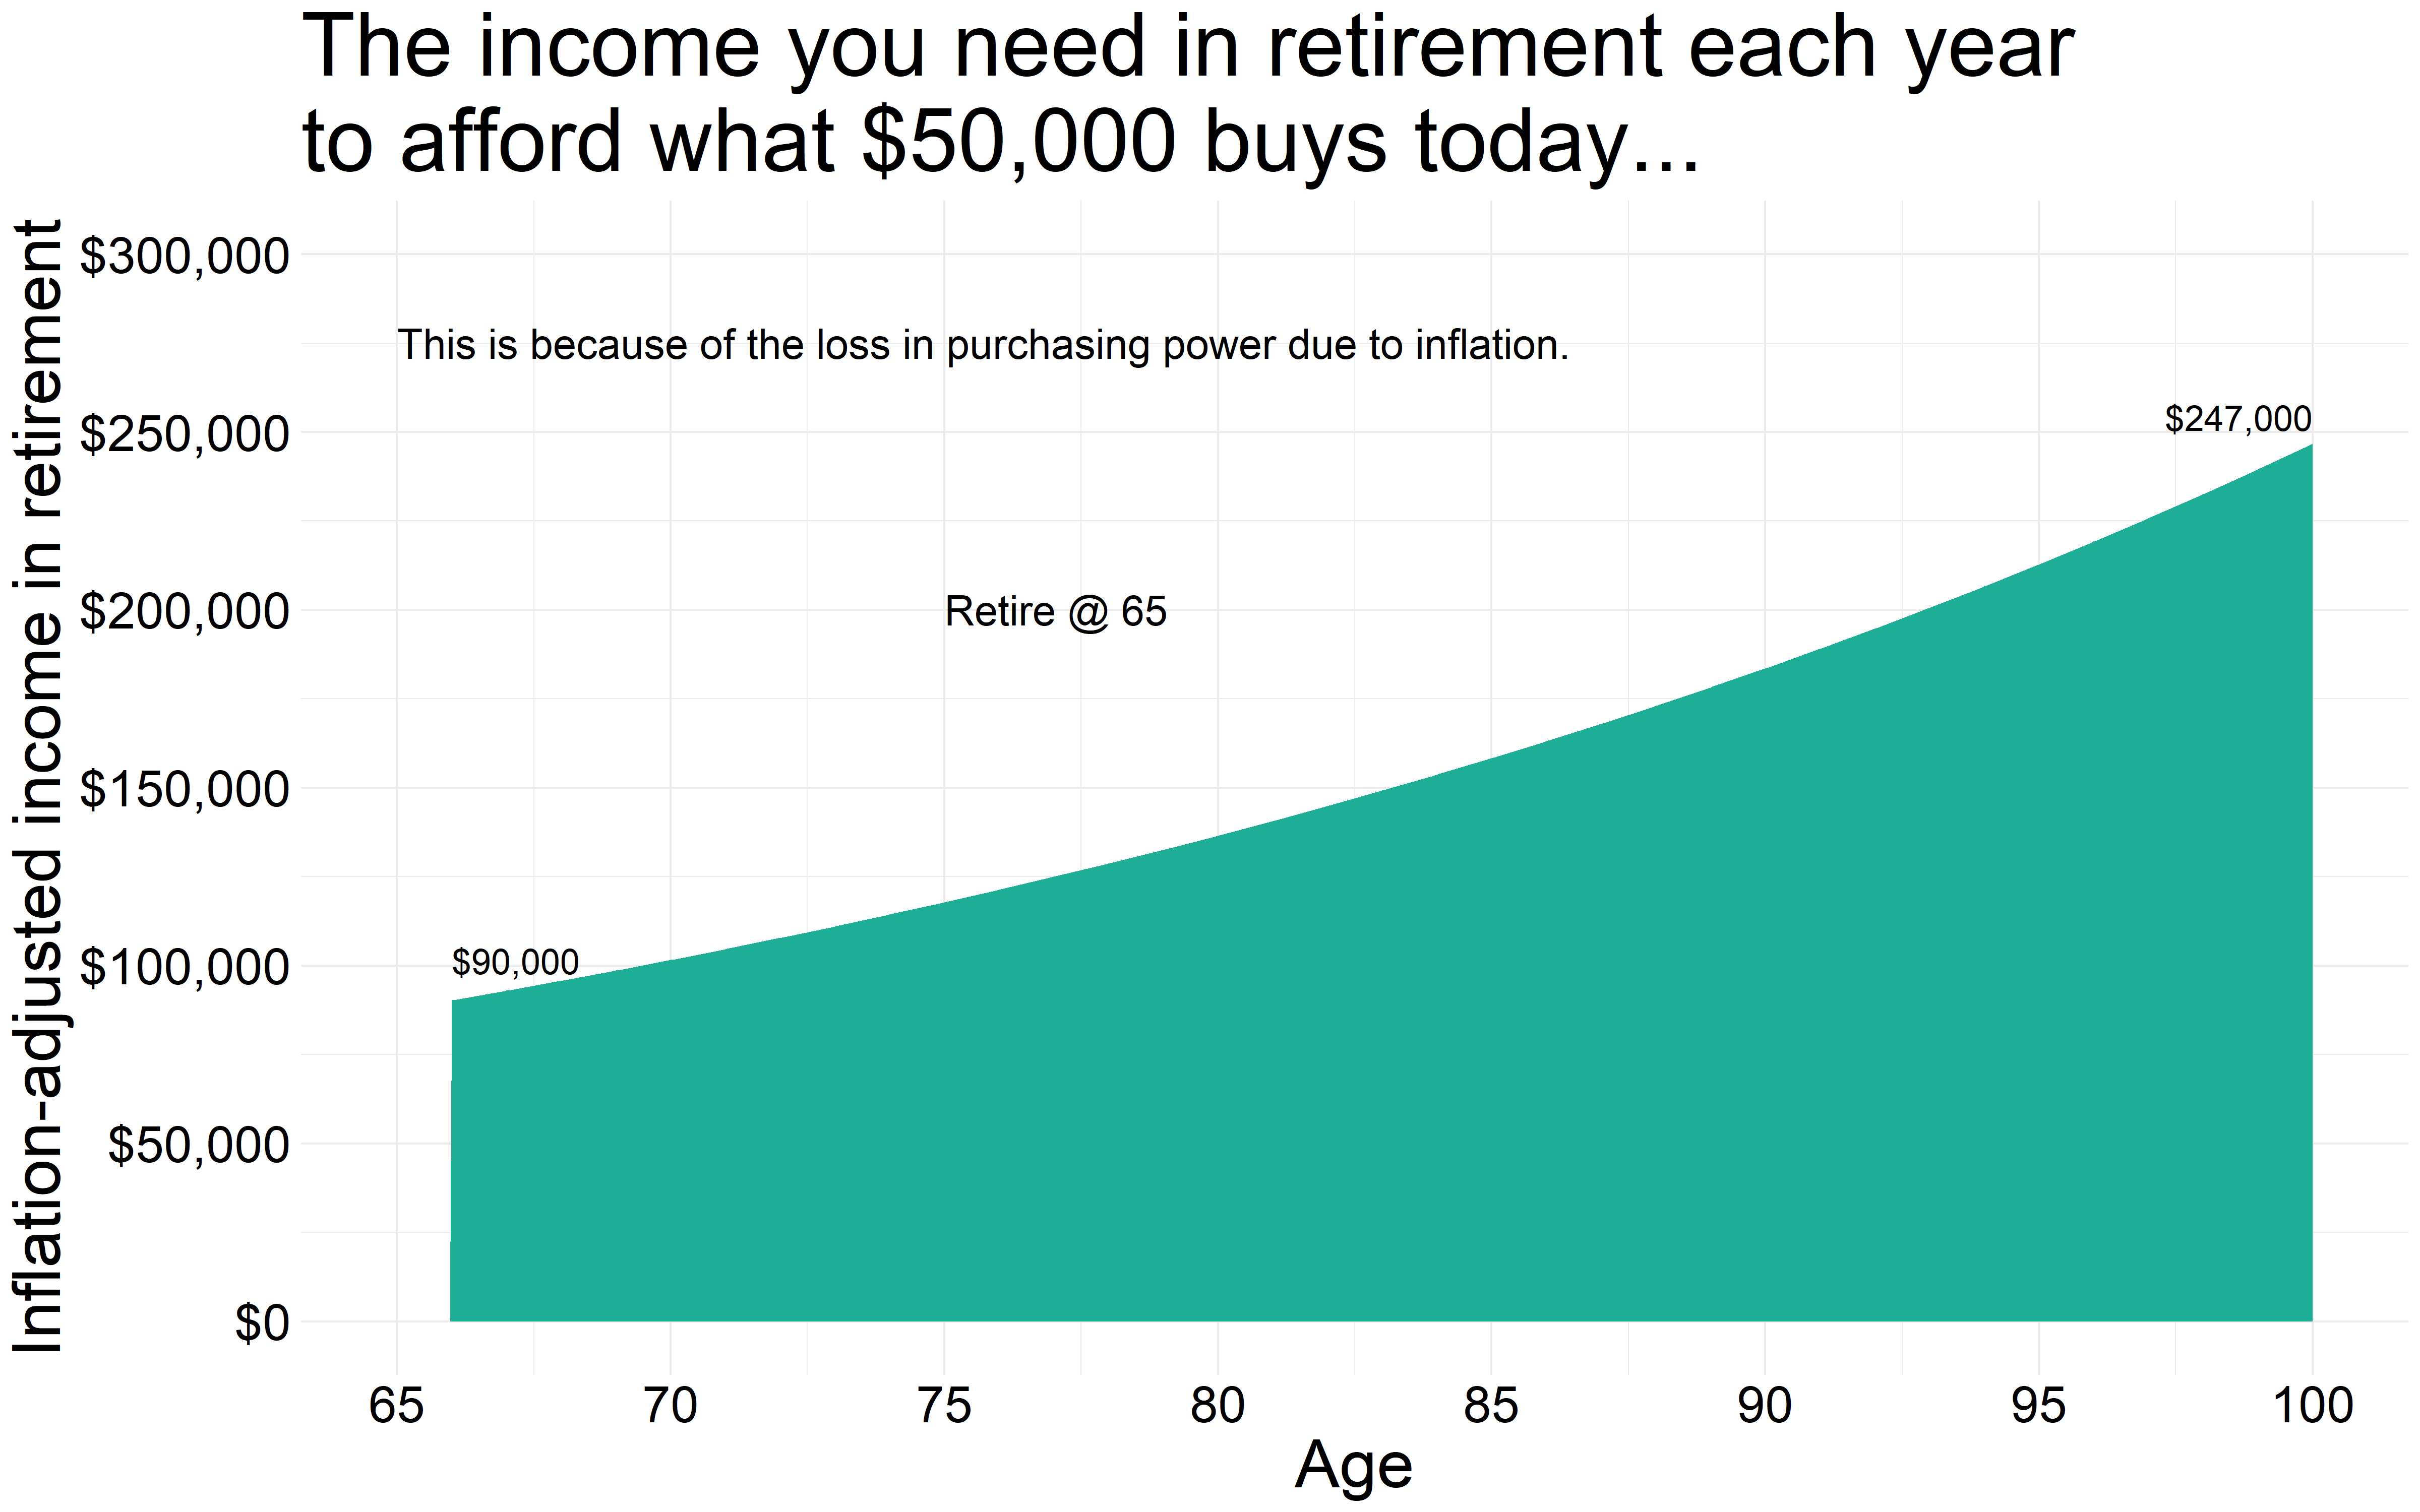
    But that is in today’s dollars when you are 45. You’ll need to inflation-adjust that to when you retire, say at age 65.

    So, this is what today’s $50,000 will look like when you retire 20 years from now, at age 65 and through retirement.

    This is planning for a 100-year life expectancy which you might think is long, but it may not be.

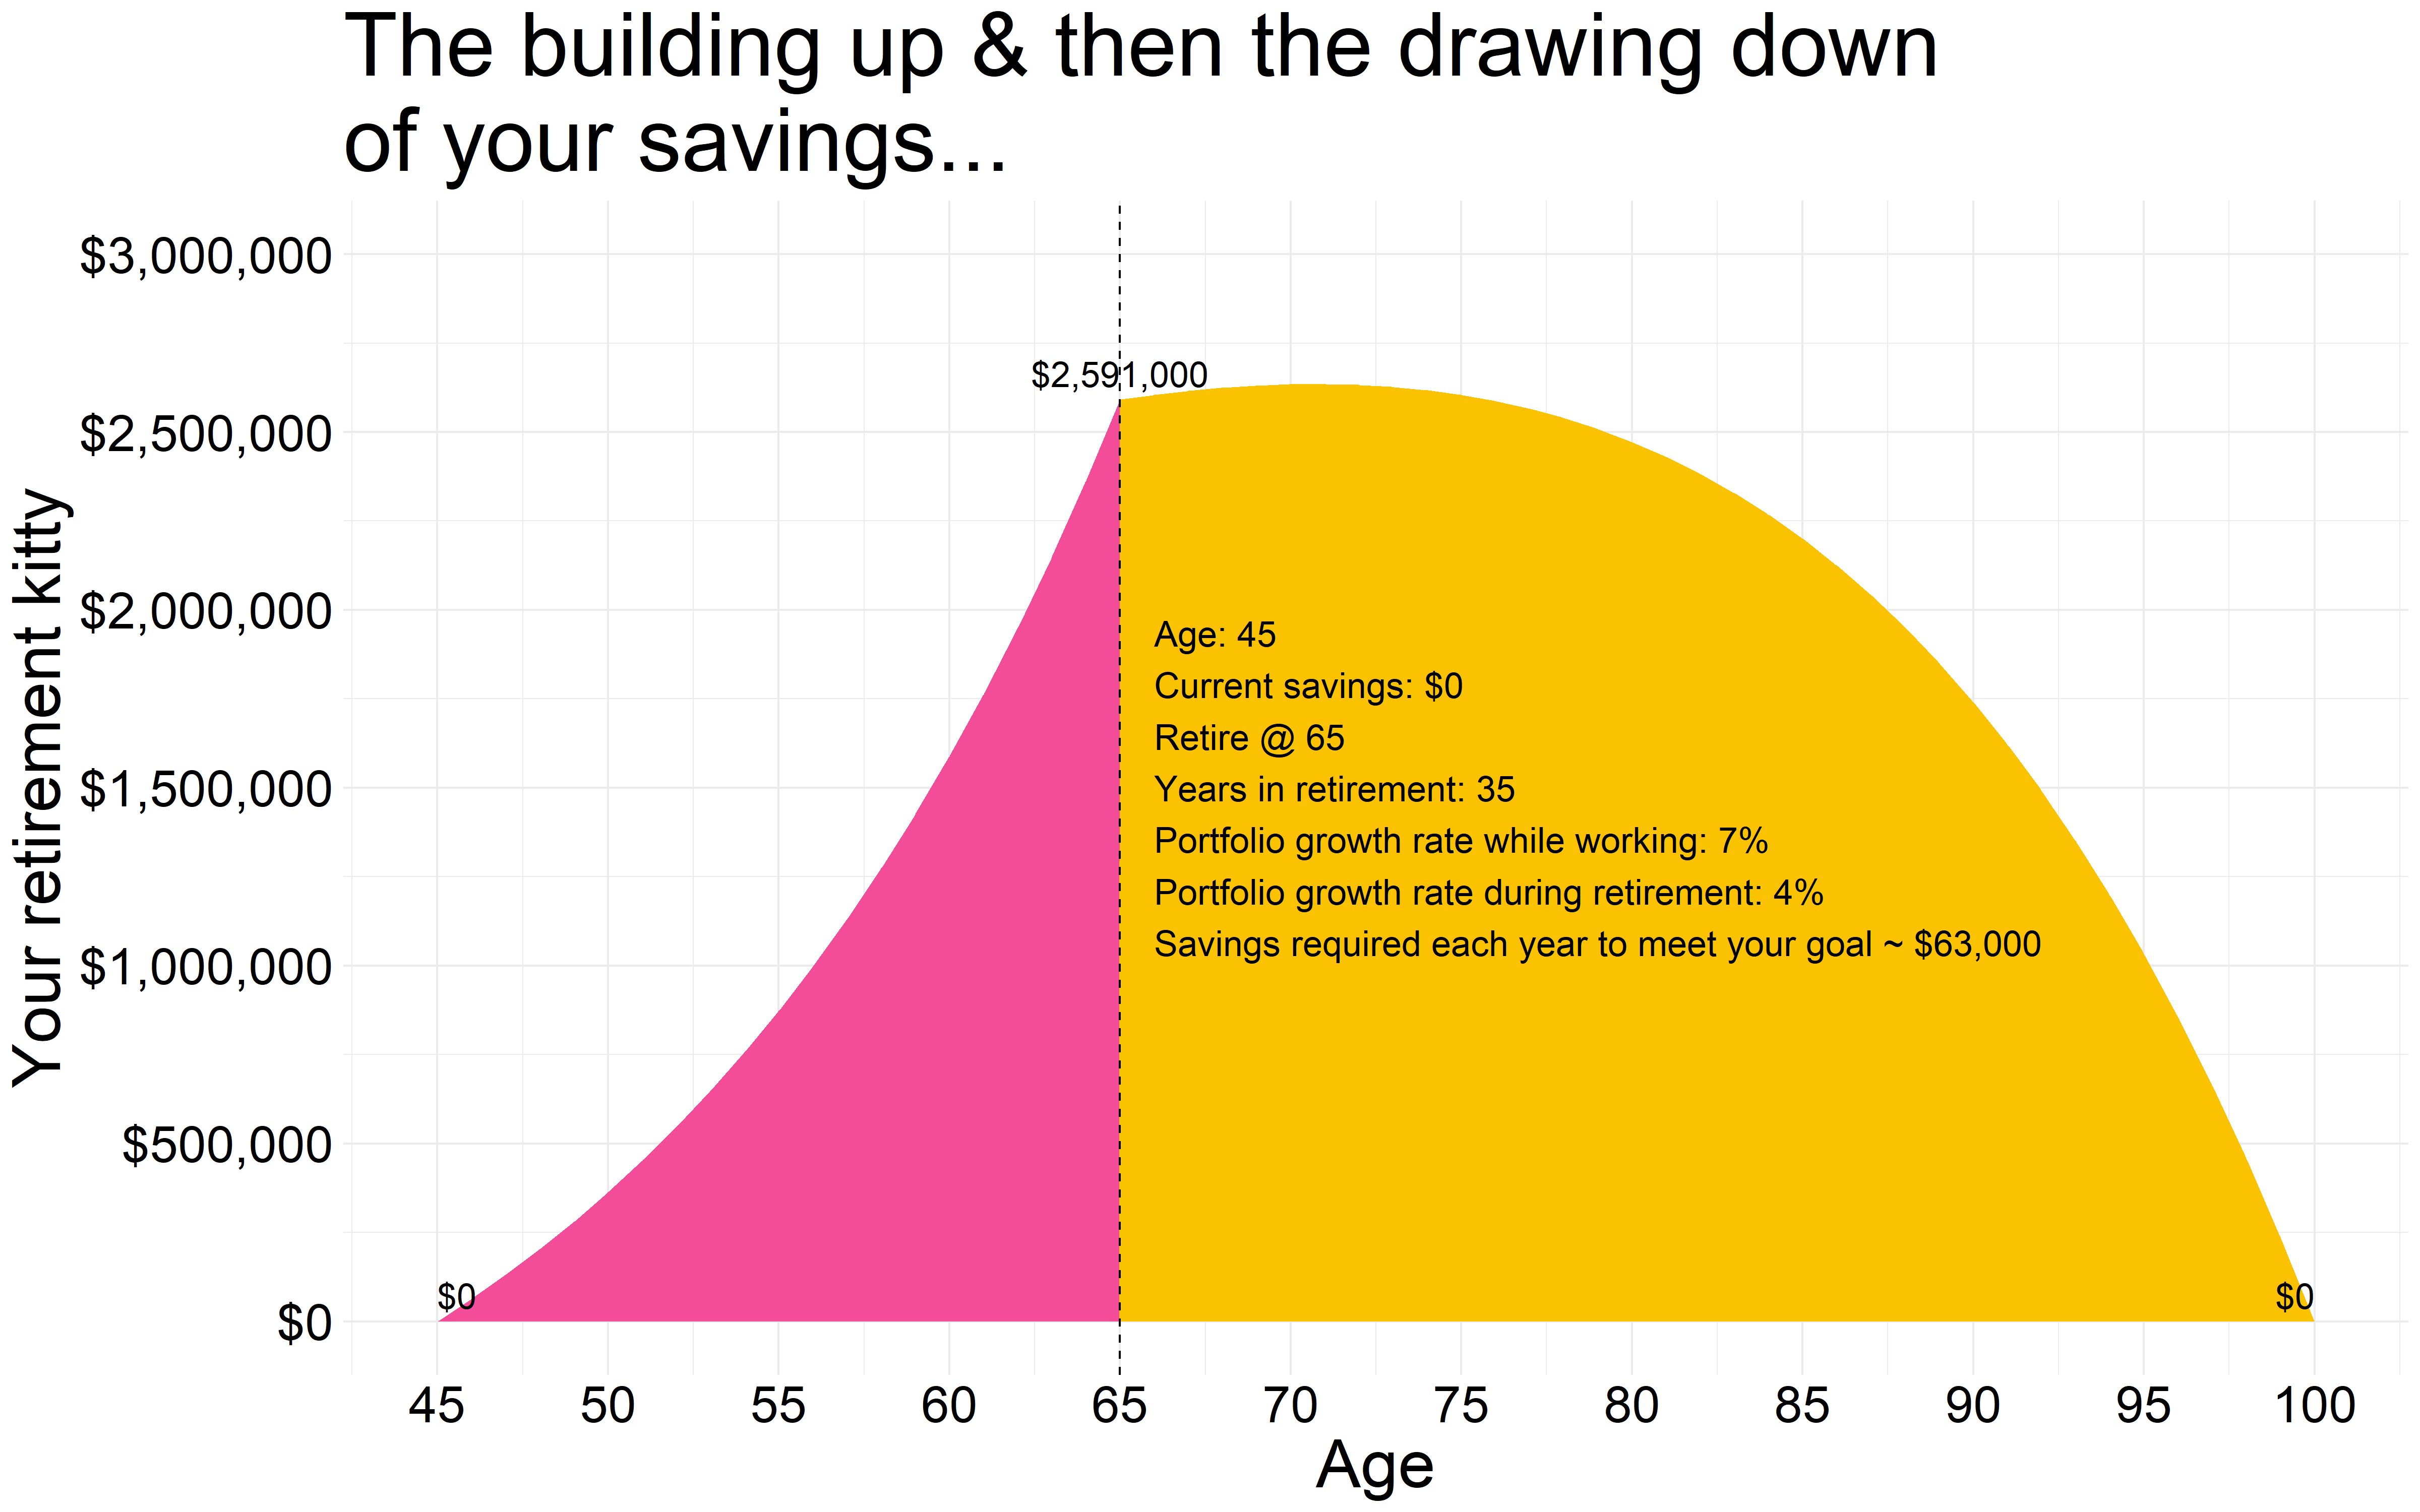
    So, to recap, you are 45, just getting started and plan to retire at 65 and draw $50,000 a year in income in today’s dollars from your savings for 35 years in retirement.

    How much would you have to realistically set aside each year from now till you retire?

    $63,000 😮 .

    We get that number through standard annuity math that we can find in any finance textbook.

    And with those savings deployed into a decent portfolio of investments, this is how you’d build up and draw down your wealth…

    But $63,000 is a lot of money to save each year but that unfortunately is the implication of lost time. And the fact that you are reading this means you are likely not starting out with zero savings so that helps lessen the burden a bit, which we’ll see later below.

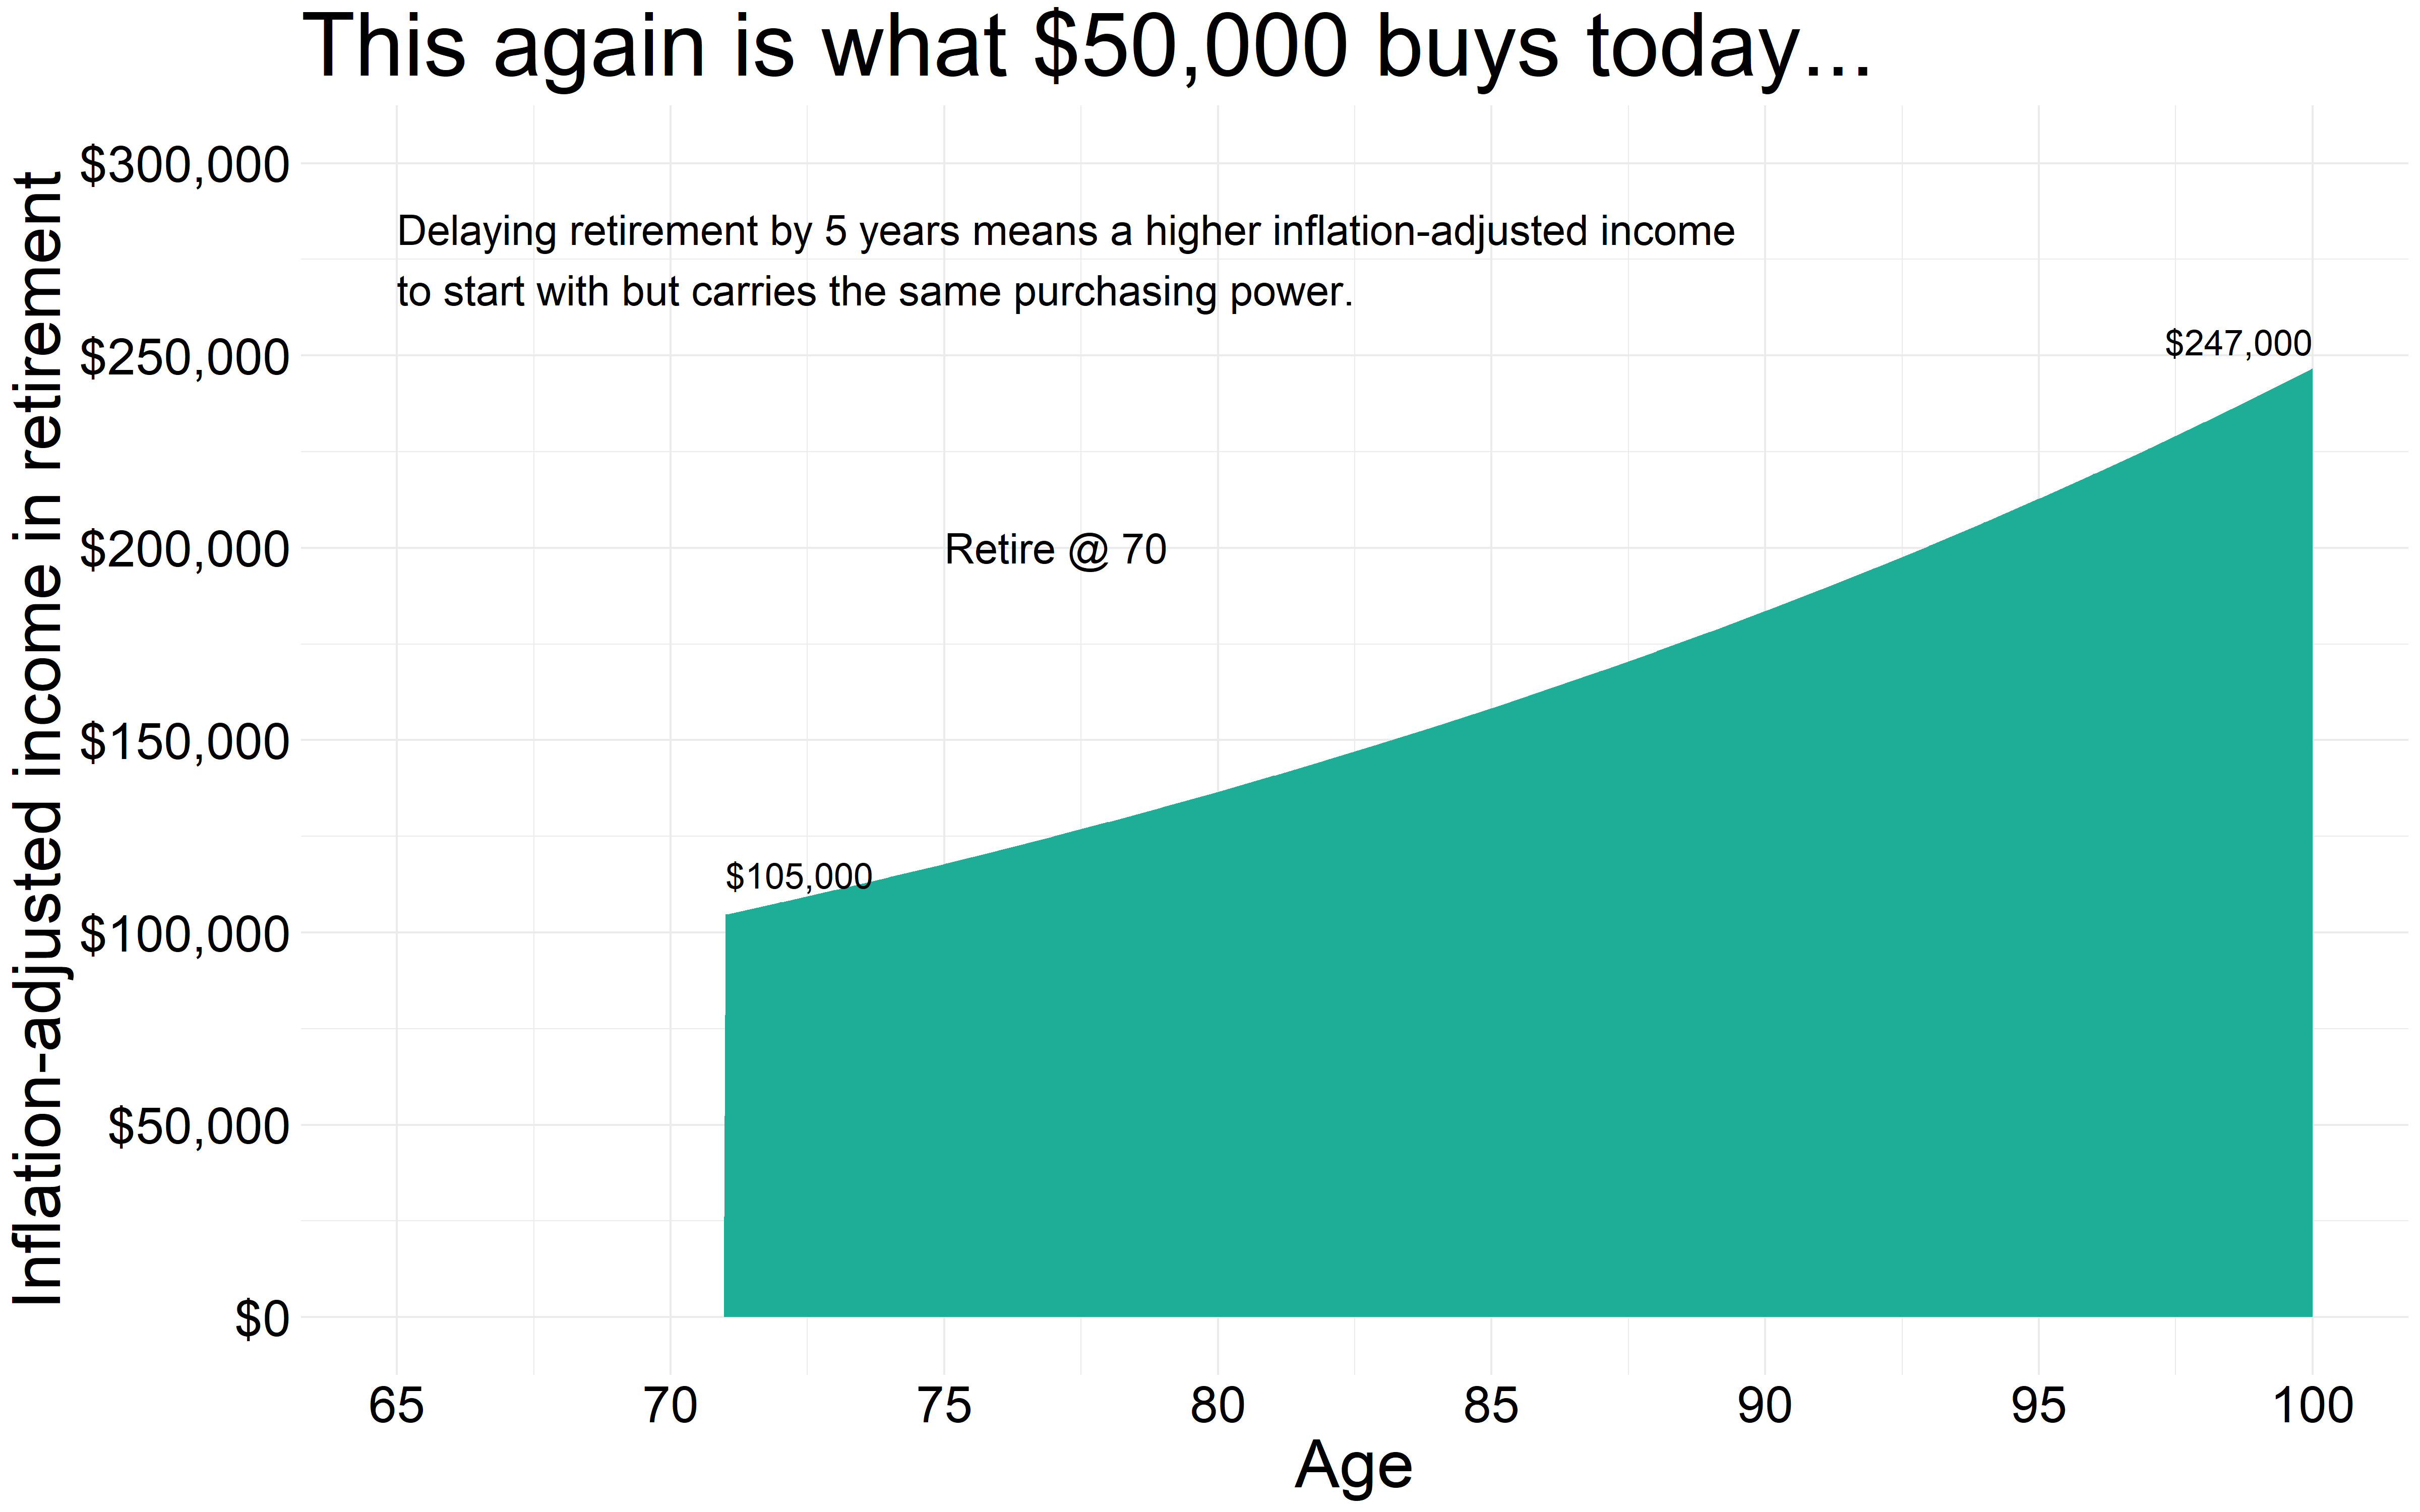
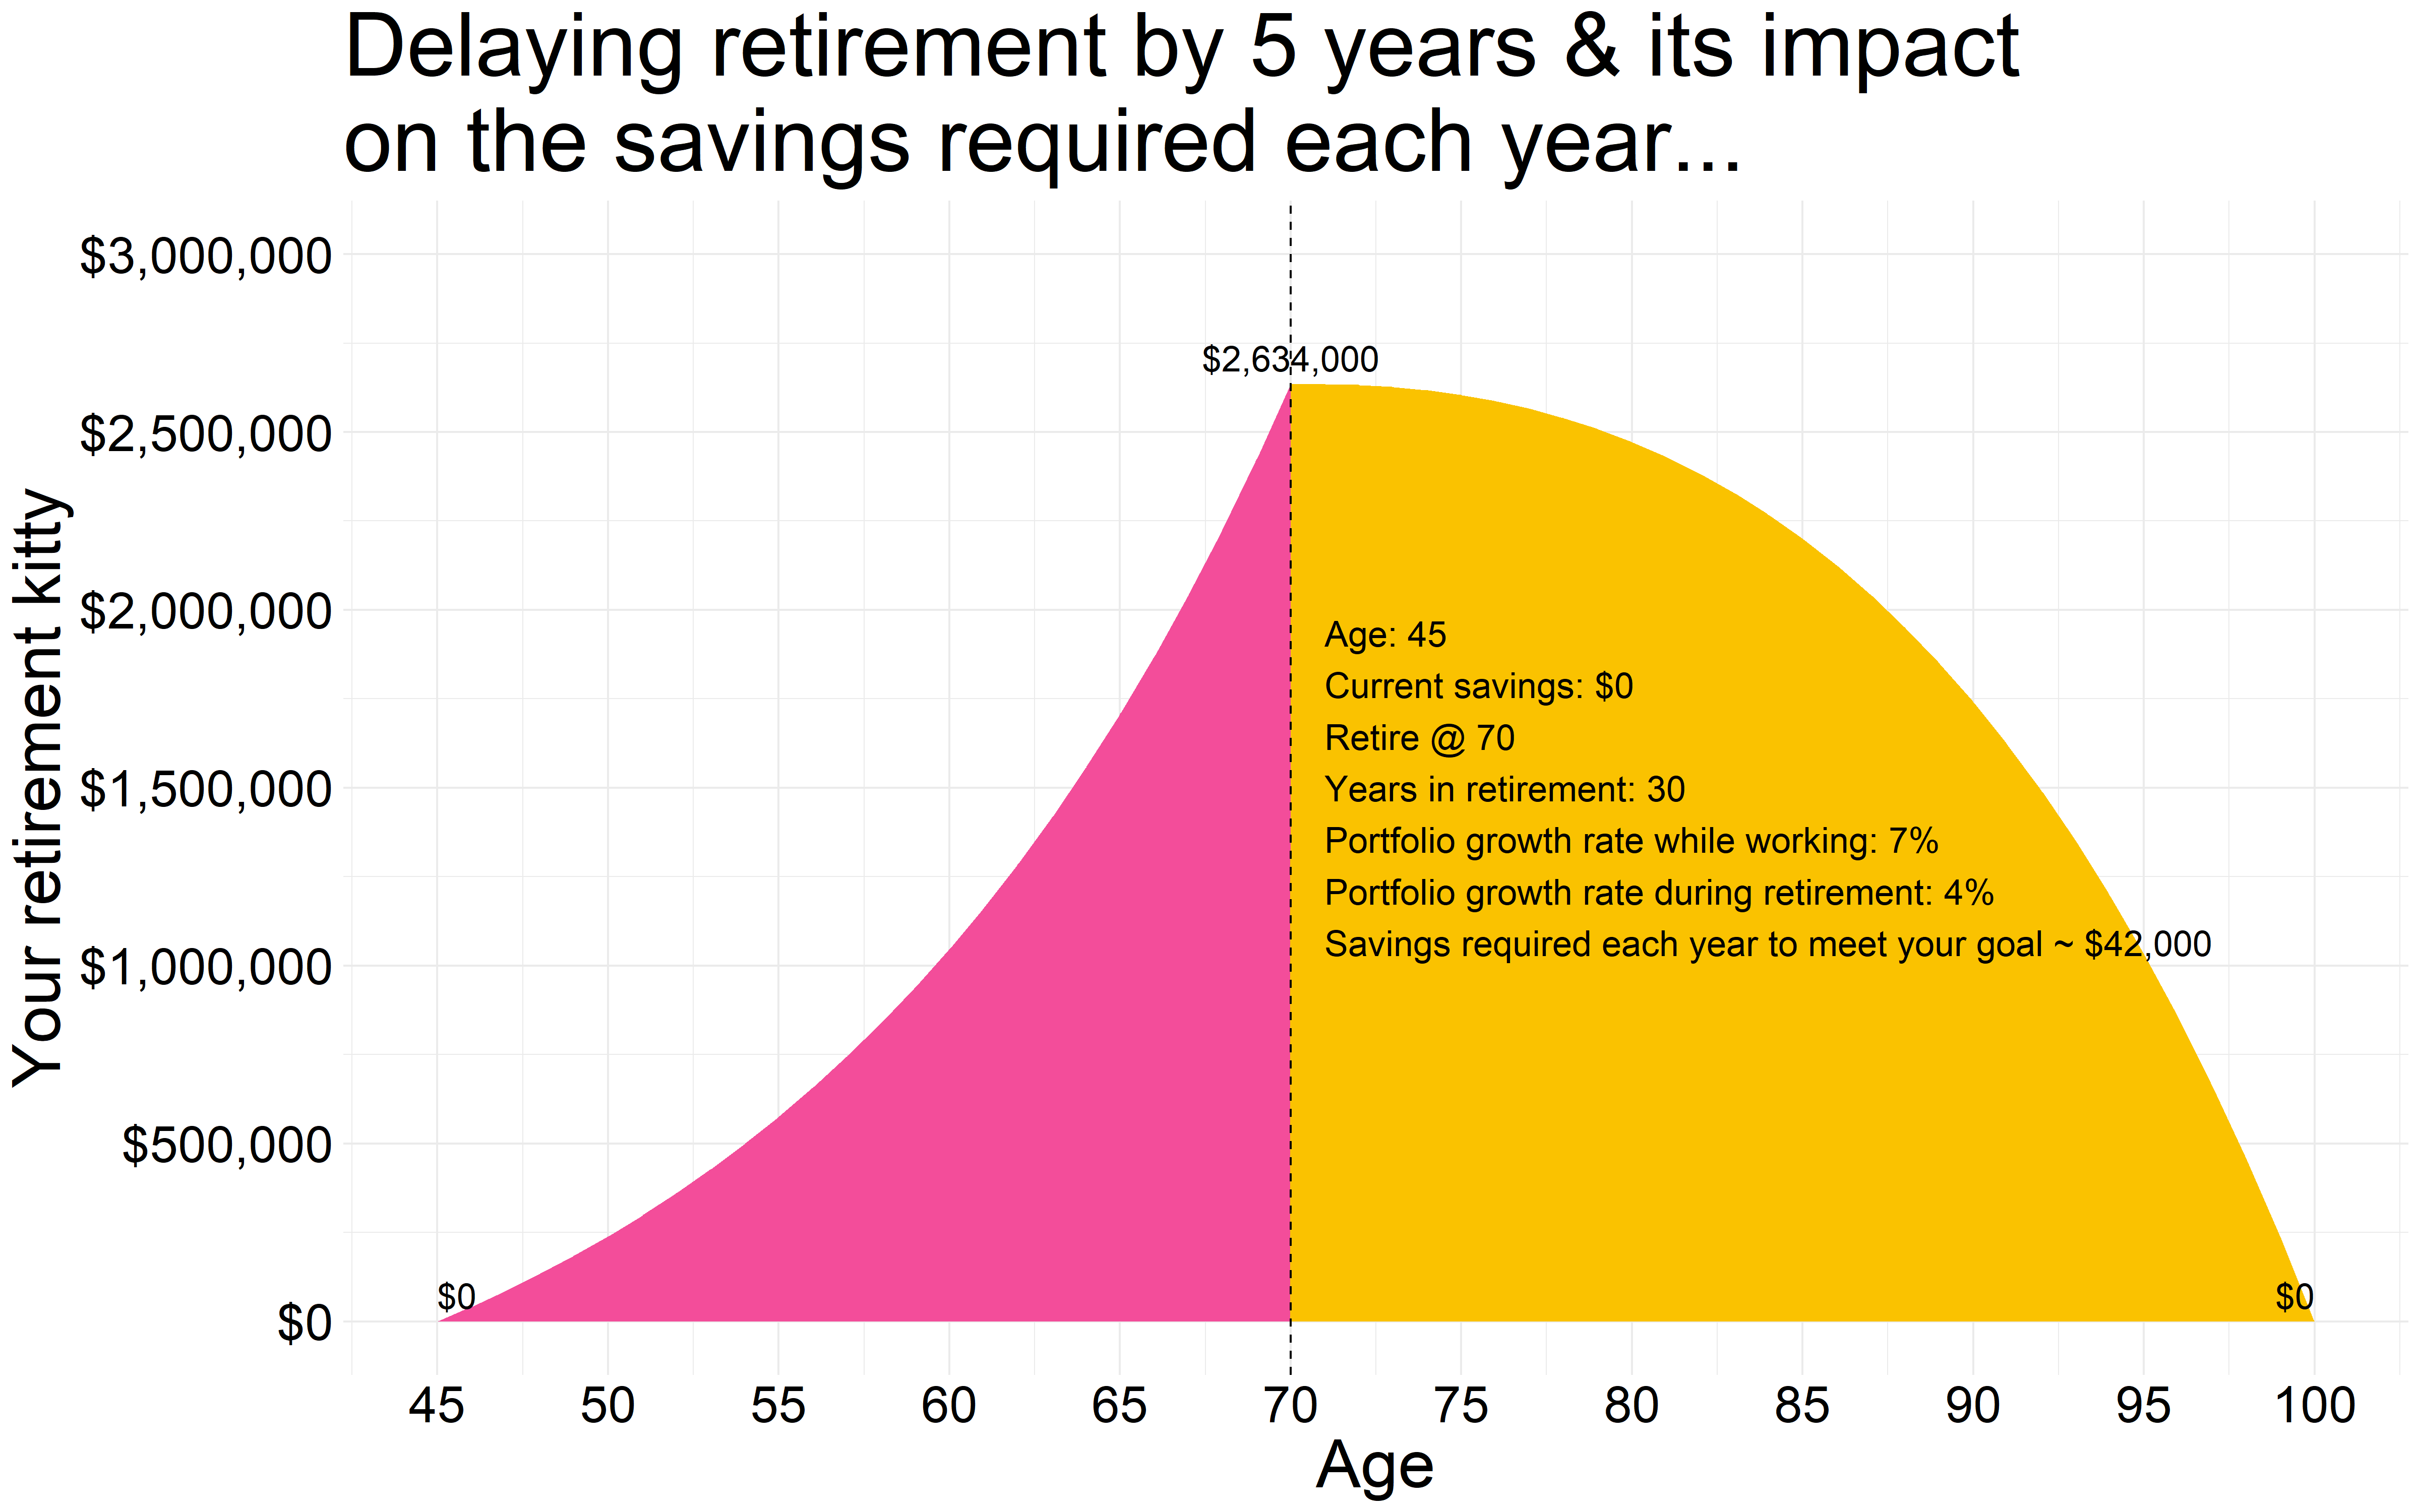
    But back to the original discourse, say you could somehow delay retiring for another 5 years. That pushes your retirement age to 70 so now you only have to pay for 30 years in retirement.

    This is what that same $50,000 a year in purchasing power looks like with that delayed retirement…

    And the amount you need to now save drops to $42,000 a year, a bit more manageable sum than before.

    Working longer has other benefits besides just making our finances easier. Work keeps us engaged and thinking which helps stave off diseases that mess up our brains. And if we’ve found our life’s work, we’d be happier and healthier long into old age. I say never retire but that’s me.

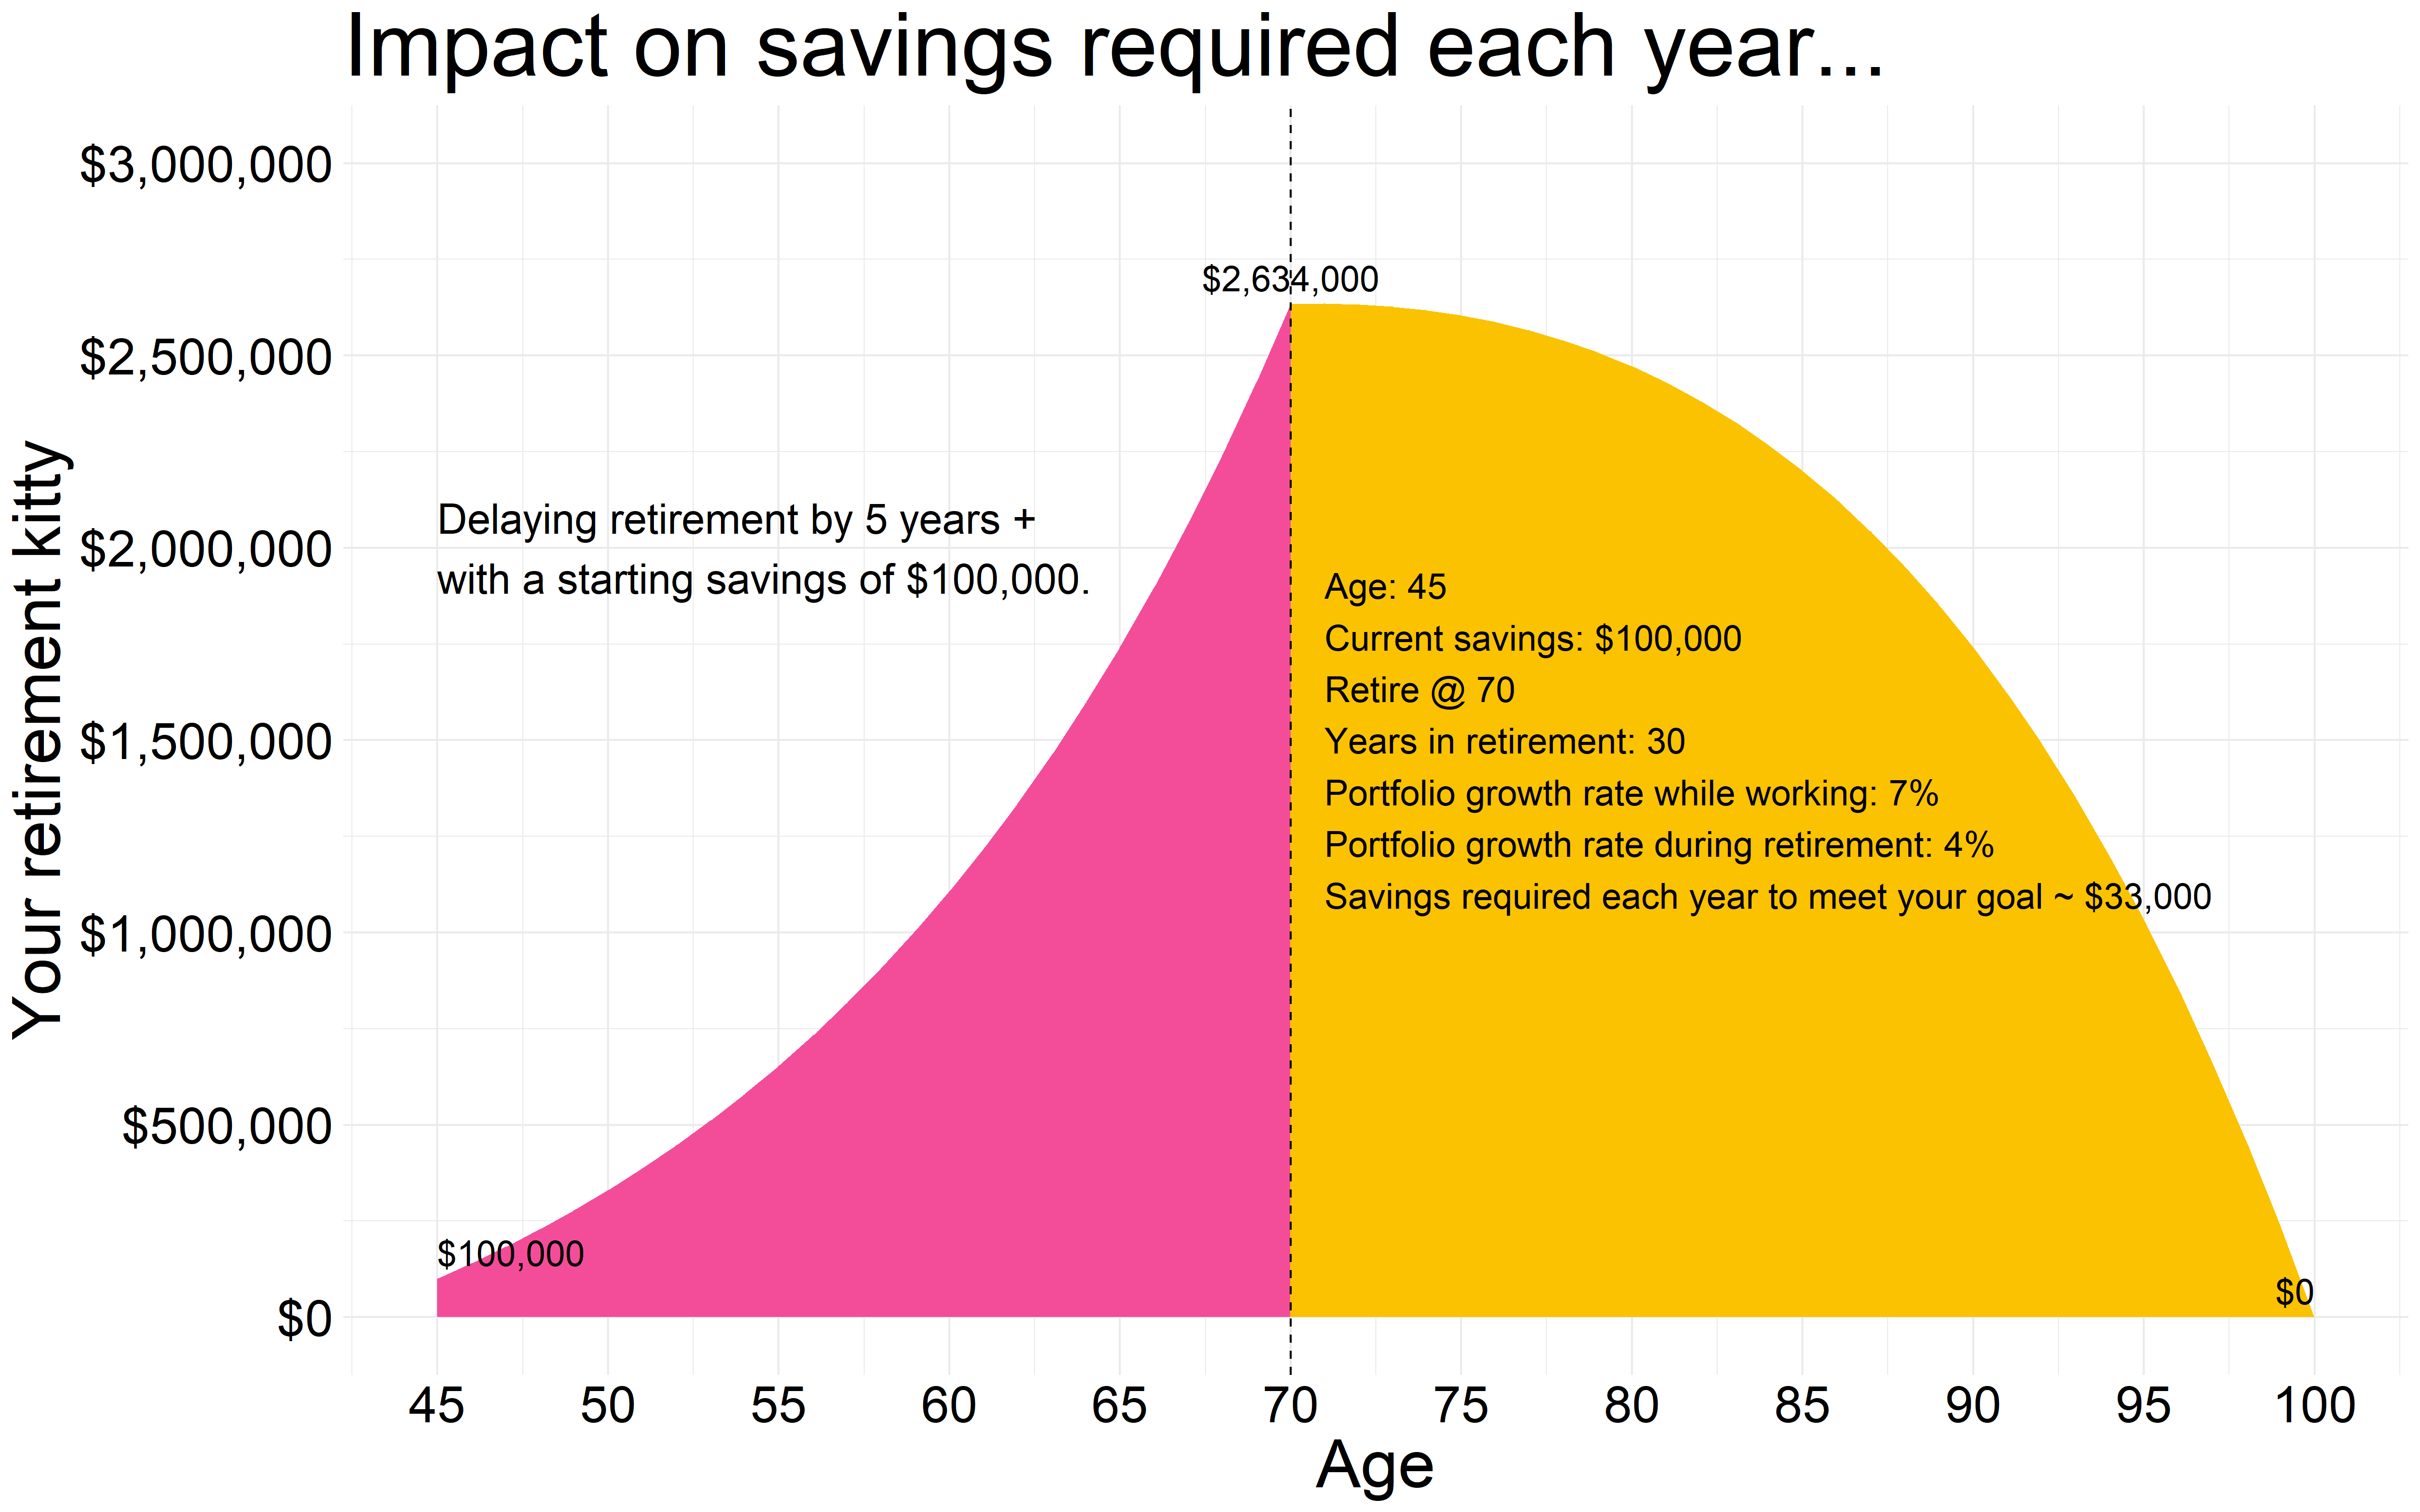
    But back to the discourse, again, say you have been doing some savings here and there and were able to stash away $100,000 by age 45. And with a delayed retirement to 70, the amount you need to now save each year further drops to $33,000.

    That is manageable on many fronts including the fact that you can do a good chunk of it in your 401(k) plan at work.

    So, this is roughly how to plan for any goal, not just retirement. We can play around with the inputs but time, as we all know, coupled with systematically investing our savings into a reasonable plan sets us on easy street. And the earlier the start, the easier that street gets.

    Starting late is never fun, but it is what it is. Overreaching for yield to compensate for lost time is not the solution though. We control what we can and that is how much we save, how much we spend and how long can we delay the start of the retirement spending cycle.

    Thank you for your time.

    Cover image credit – Andrea Piacquadio, Pexels

  • Technical Analysis Is For Suckers

    Technical Analysis Is For Suckers

    I get to listen to the radio sometimes and I still find (unfortunately) a plethora of shows where people call in to ask whether a given stock is a buy, sell, or hold.

    So, think about this. You call into a radio show to talk to a stranger, okay a professional stranger, who knows nothing about you, doesn’t know your circumstances, doesn’t know about your work or about your family, doesn’t know what other investments you own or how a particular investment fits into your overall pie and what else are you doing with the rest of your money, whether you are afloat or drowning in debt, none of those things.

    And yet you ask him (always a him) whether you should buy, sell or hold a stock? Crazy I say but this is how many invest.

    So, there is this person who hosts this radio show where people call in for what I deem non-contextual advice but, in an attempt to sound relevant, he throws out terms like stochastic indicator this and Bollinger Bands that, moving average this and sideways trend that. Lots of fancy jargon that some consider investing but has nothing to do with the real business of investing.

    And all that word magic is what they call technical analysis. It is about identifying patterns in past stock prices and using them to predict future prices. That is to say that profits don’t matter, interest rates don’t matter, valuations don’t matter, long-term sustainability of a business don’t matter. The only thing that matters are the zigs and zags in stock prices and profiting from it, if that was ever possible.

    But we know technical analysis is dumb. Anyone who gives any credence to anything that has technical analysis in anything they say, their entire premise is dumb. And a quick search will lead us to countless studies that prove that it is dumb.

    And I bet the host of that show knows deep down that it is dumb. But then he’s got an audience to serve.

    Technical analysis is what I would call making investing decisions based on data without theory. You look at the time-series data for a stock, concoct some smart-sounding theory around it and call it something technical.

    If what transpires deviates from what was predicted, you concoct a new theory and call it something else. And it must sound technical of course.

    Talk about concocting a theory, Tyler Vigen runs a site called Spurious Correlations that attempts to fit all sorts of totally unrelated data series to each other. Like say the number of people who died from getting entangled with their own bedsheets versus say the amount of per capita cheese consumption.

    And with correlation coefficient between the two totally unrelated data series approaching 0.95 means that if you want to save people from their own bed sheets, make sure they don’t eat cheese. That is technical analysis in a nutshell.

    Gary Smith in his book, Standard Deviations continues with the fun by generating some stock price charts for a fictional company whose stock price starts at $50 and then each day, the price changes based upon the outcomes of 25 consecutive coin flips. If the coin lands a head, the price goes up fifty cents and if it lands a tail, the price goes down by 50 cents.

    So out of the 25 consecutive coin flips, if fourteen landed heads and eleven landed tails, the stock price would rise by $1.50 the next day.

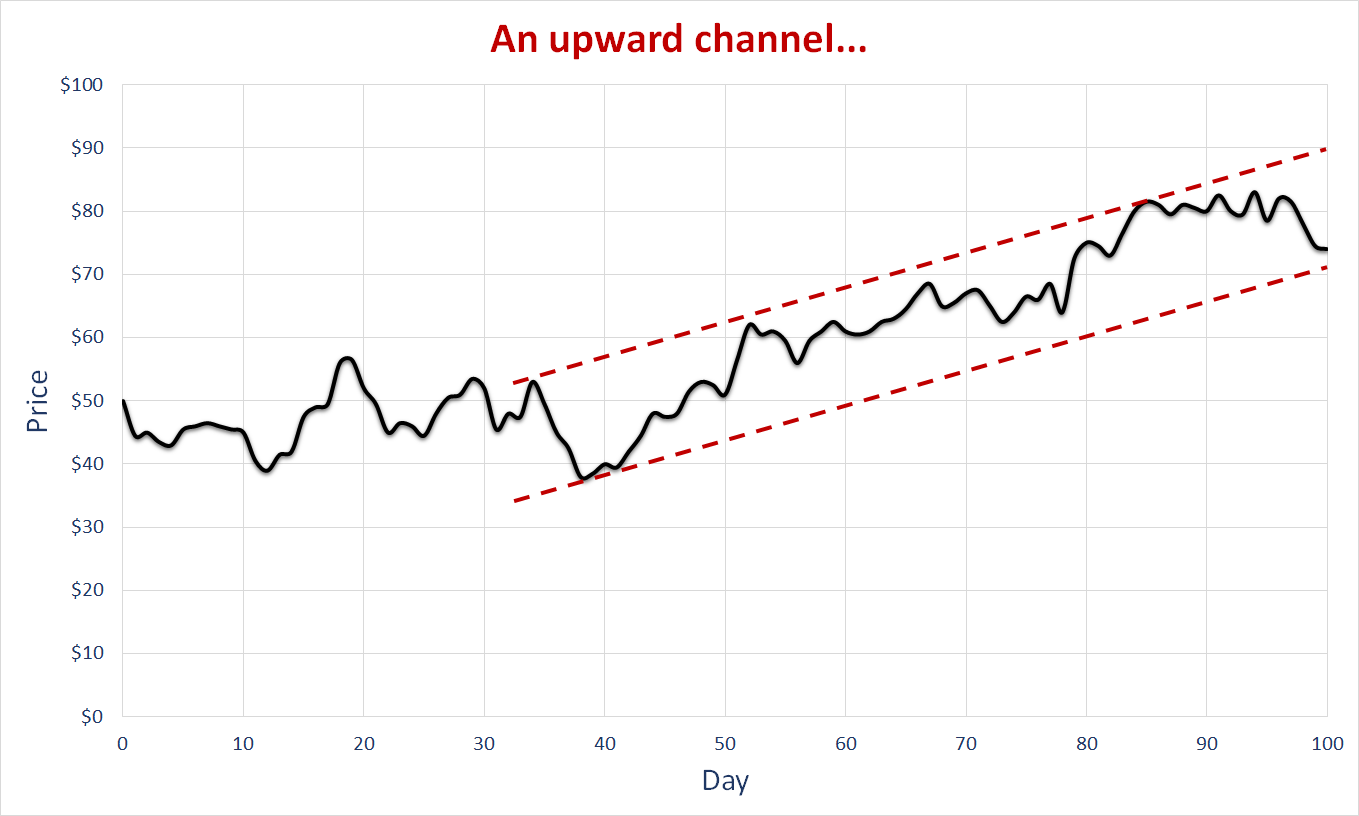
    And I bet if these charts were to be shown to that person on the radio show, he would get all technical and describe it as…

    And quite naturally, if the stock price is trending upwards, it would continue to trend upward to the moon and beyond so buy, buy, buy.

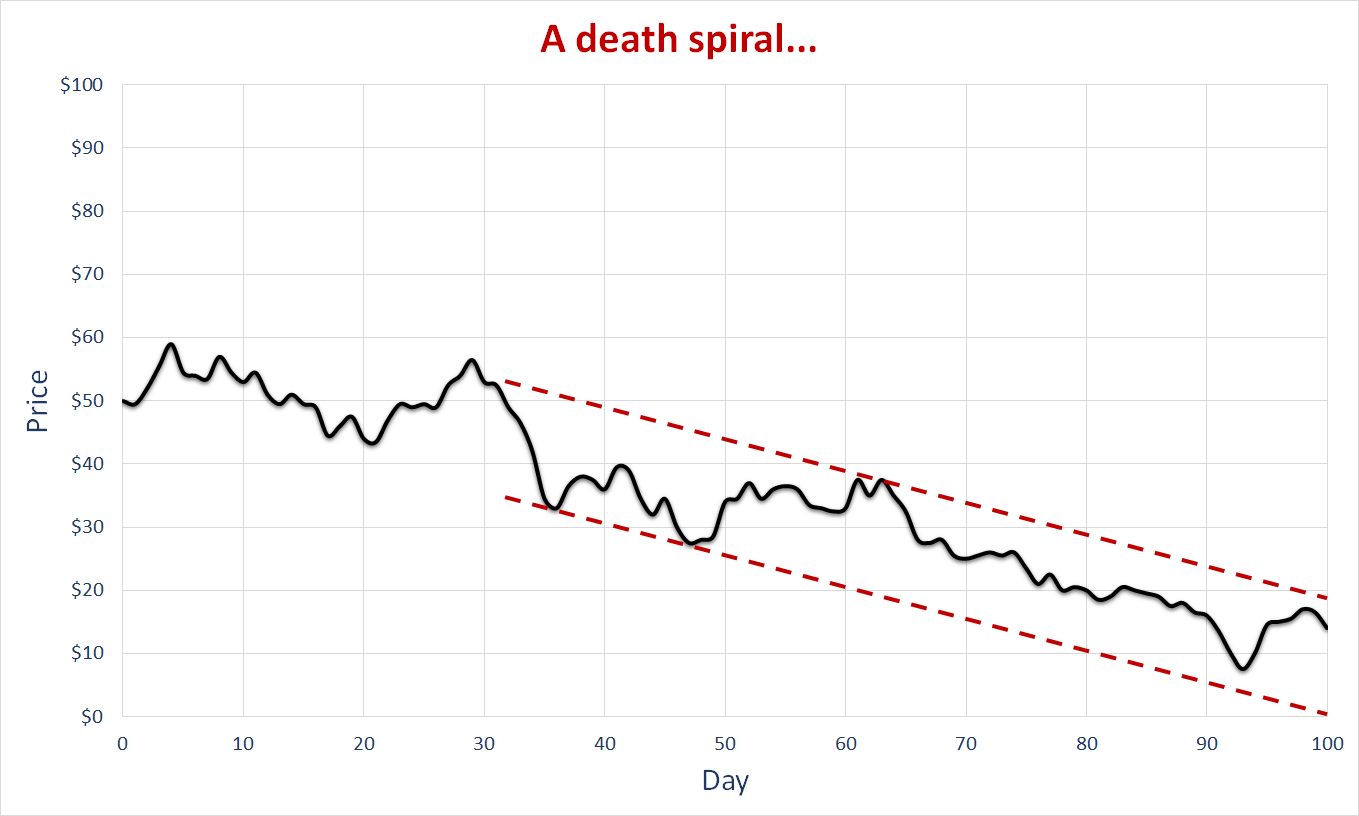
    Or if you get a chart like below, a death spiral, you never want to go near it because this is where your money goes to die.

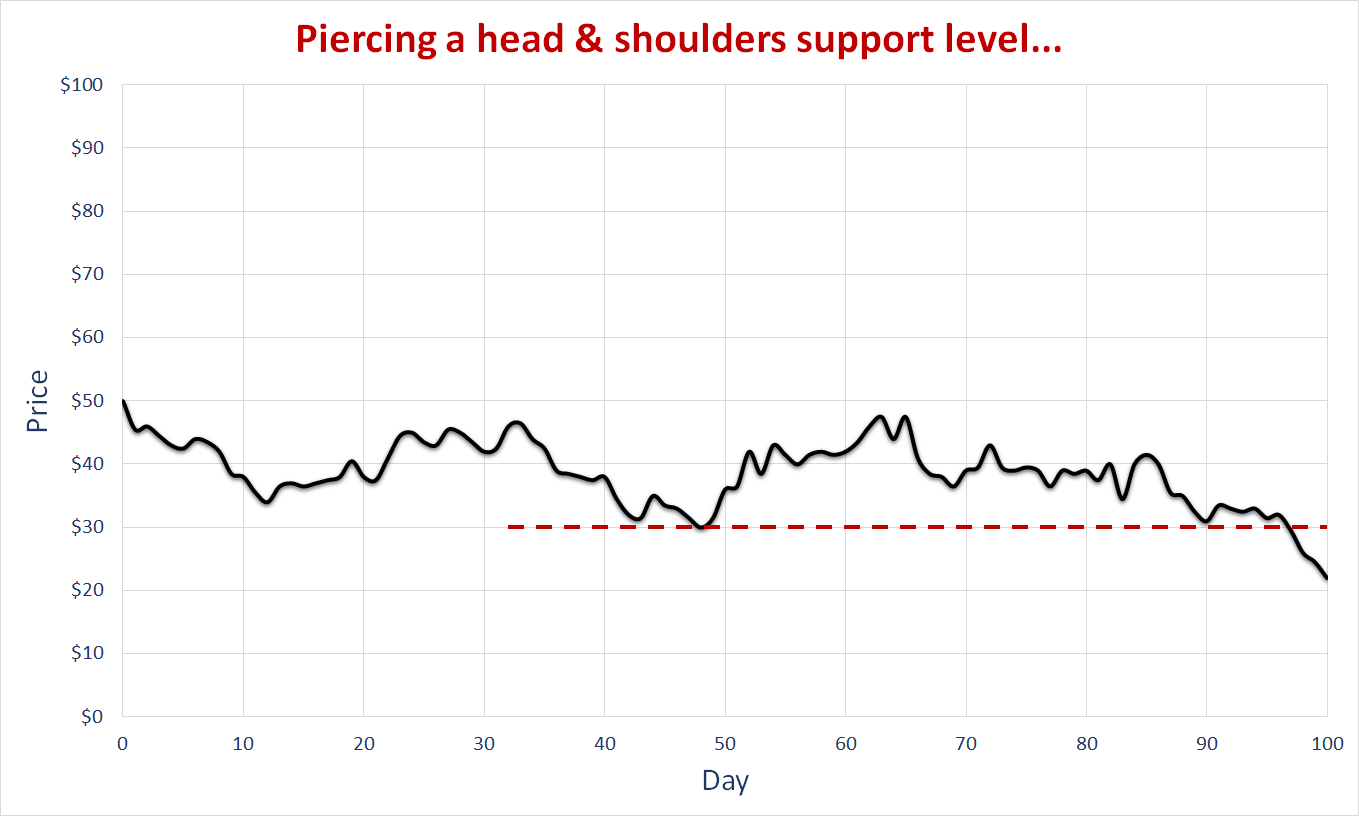
    The chart below had a strong support at $30 and then it was pierced. And we know once that support is pierced, it is all over.

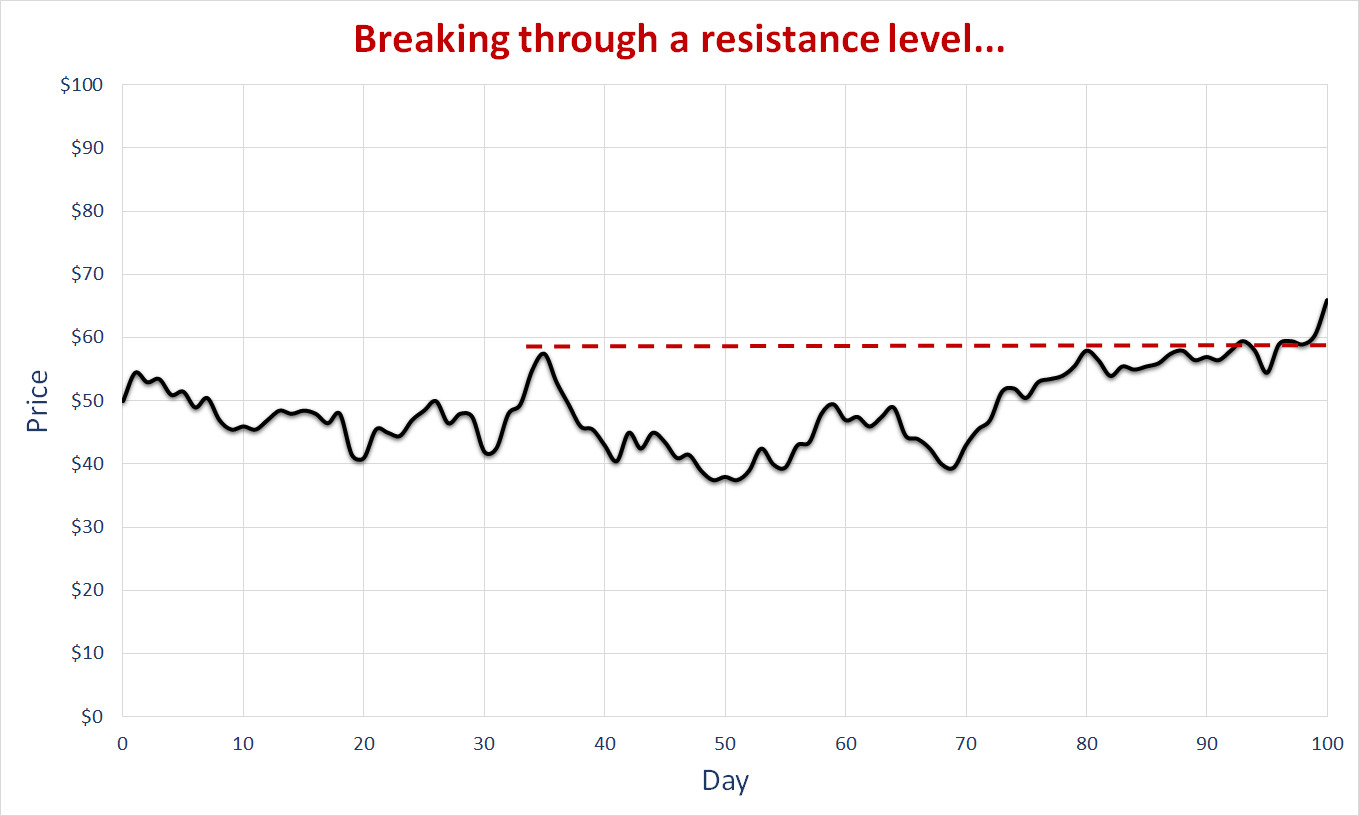
    Or the one below that shows clear resistance at $58 but now that the stock price has broken through that impregnable resistance, it is again all the way to the moon and beyond.

    We know how silly all this sounds. But it stops being silly once we find out how much money is transacted each day based upon all this silliness.

    Thank you for your time.

    Cover image credit – Katie, Pexels

  • Women Make Better Investors

    Women Make Better Investors

    I wish we would see a day when a majority women are at the helm of our businesses and the markets. I wish child-rearing, toddler-totting mothers someday rule Wall Street and investment houses across the globe.

    Consider me biased being a dad to two beautiful daughters but there is plenty of anecdotal evidence that corroborates the fact that women not only are more judicious risk-takers, but that trait also helps make them better investors. They make for better business leaders because they focus more on sustainable, long-term profit maximization instead of the usual gun-slinging, macho-capitalistic, short-termism that is the norm in today’s male-dominated world.

    Plus, the protective, nurturing instincts women bring to the table would undoubtedly make the world a better place while reducing systemic risks and the associated savagery the world has endured since time immemorial, mostly again due to male domination in business, politics and the markets.

    Case in point, Iceland, a country that right up until 2008 was rated by the United Nations Human Development Index as the best place to be a human being on this planet earth.

    And then it almost went bankrupt when three of its largest banks collapsed, holding debts more than 10 times the size of that country’s GDP and in turn impinging a lot of grief and misery on its generally happy citizens.

    The country’s almost entirely male-run banks levered up big and gambled customers’ savings into ‘can’t lose’ investments that turned out to be so complex that no one had any clue what they owned.

    And no one cared to ask the hard questions because all parties involved were making money hand over fist in the years leading up to the collapse. The only financial company that survived and remained profitable throughout that episode – Audur Capital, an almost all-women run firm.

    Iceland’s doing fine now because the country learned its lessons and put in place a set of laws requiring that the system be adequately represented by the fairer sex at all levels of government and businesses. A segment from this Der Spiegel link sums that episode well.

    “The crisis is man-made,” claims banker Halla, 40, who like all Icelanders, is only addressed by her first name. “It’s always the same guys,” she says. “Ninety-nine percent went to the same school, they drive the same cars, they wear the same suits and they have the same attitudes. They got us into this situation — and they had a lot of fun doing it,” she says. Halla criticizes a system that focuses “aggressively and indiscriminately” on the short-term maximization of profits, without any regard for losses, that is oriented on short-lived market prices and lucrative bonus payments. “It’s typical male behavior,” says Halla, who compares it to a “penis competition” — who has the biggest?

    That brings us to this aptly titled paper, Boys Will Be Boys by Brad M. Barber and Terrance Odean of UC Berkeley’s Haas School of Business. It concludes that men in general, trade their portfolios 45 percent more than women and earn annualized risk-adjusted returns that are 1.4 percent less than those earned by women. These differences are more pronounced between single men and single women; single men trade 67 percent more than single women and earn annualized risk-adjusted returns that are 2.3 percent less than those earned by single women.

    And I know the reasons why. Some of us are compulsive gamblers and cannot help ourselves. Others think that they are in this race, and they must beat this other guy at this ‘game’. Why worry about the long-term when you get to brag about the killing you just made on this one stock with no mention about the rest of the losers you own in your portfolio?

    The problem though is that this is widespread. I see it all the time. Why are you holding so much cash? Oh, I thought the market was going down, so I cashed out my 401(k).

    Really? That was the reason you sold? When you sold, someone else bought. Who do you think that someone else is?

    But then when the market eventually recovers, which it invariably does, they remain stuck. That one blunder sets them back years if not decades.

    And we all know who makes most of these market-timing calls? Almost exclusively the men in the households.

    And if you see what I see out there with the portfolios I encounter, it makes me wonder if they would have been better off locking their money off in annuities and junky whole-life policies. At least they wouldn’t be able to touch their savings without encountering stiff withdrawal penalties. And I can almost bet that most would do better with these egregiously inferior products than what they currently do with their investments.

    But enough talking about the folks who appear to know what they are doing and let us talk about the folks who should have known what they were doing. They had seemingly cracked the code to endless profits with never a loss in sight.

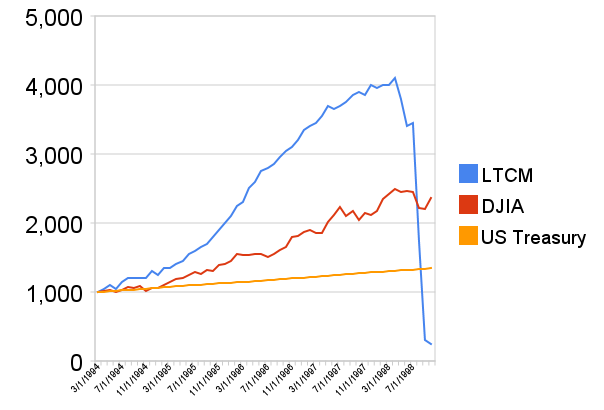
    And all Nobel-laureates at that and of course all men, who started Long Term Capital Management (LTCM), a hedge fund that tried to capitalize on bond mispricing and to really make a killing, they levered up 25 to 1.

    It worked like a charm until it didn’t, and poof went all the money – literally overnight.

    Source: Wikipedia

    This is just one example of many of the supposedly best in the business and almost exclusively all overconfident men at the helm running people’s life savings into the ground.

    But back to why I think women are genetically predisposed to be better at investing is because we know they’ll approach this entire process from the safety-first angle.

    Many of the great financial disasters we’ve seen have been failures to foresee and manage risk.

    Howard Marks

    That overconfidence, that self-delusion is seldom found amongst women. They are more likely to ask questions, seek help when needed and in general, don’t tend to go near the “too hard to understand” pile.

    That is the general theme around how I invest my own money and the money our client families entrust us with. I am waiting for the day where I can build a portfolio of mostly women-led businesses that offers me just the right amount of diversification. And I bet when that portfolio eventually rolls around, it’ll beat the pants off of any other portfolios you could find.

    That day is not here yet, but it is coming and we should all welcome it because in this fight between testosterone and estrogen, we want estrogen to win. Our future is riding on it.

    And a message to the wives, the mothers and the daughters out there, you need to get involved with what is happening with your household finances. This is supposed to be a family affair after all, and for the clients we serve, we intend to keep it that way.

    Thank you for your time.

    Cover image credit – Jonathan Borba, Pexels

  • Most Mistakes Happen In The Tails

    Most Mistakes Happen In The Tails

    The stock and the bond markets are the most efficient places to invest your savings. Owning stocks means owning pieces of businesses while owning bonds means becoming a lender to the same businesses or sometimes to the governments.

    In case a business goes bankrupt, the bondholders get paid first before the stockholders get anything. But in exchange for that apparent safety, you give up on returns, a lot of returns.

    Interest payments on bonds are fixed and hence more predictable than dividends from stocks, another reason for the lower perceived risk with bonds than with stocks. And lower perceived risk means lower expected returns.

    The price of a stock depends upon the level of current and future dividends and then you must discount those dividends at some discount rate to arrive at fair value. Everyone has different interpretations of these numbers and their collective opinions, including of those who participate to just gamble like it is some sort of a casino, gets reflected in the prices we see quoted each day. All this means that stock prices are volatile and will remain volatile.

    Dividends from small company stocks are more unreliable (riskier) than from large company stocks and hence are even more volatile than just stocks as a category. So, more risk should equal more reward, but we shall see.

    I’ve got monthly returns data for three categories of investments going back to January of 1987.

    • Bonds and specifically, long-term Treasury bonds. By buying these bonds, you are lending money to the Federal government for a decade long timeframe. And since the Federal government cannot go bankrupt, this is as risk-free of an investment as it can get, assuming you hold on to it till it matures.
    • LargeCapStocks or large company stocks. By owning them, you own little pieces of some of the biggest businesses in America.
    • SmallCapStocks or small company stocks. These businesses are nimble. They can grow fast. They can also fail easily. The risk is high, and you want to get compensated for taking on that risk. So, the expected returns should be high. Finance textbooks tell us that.

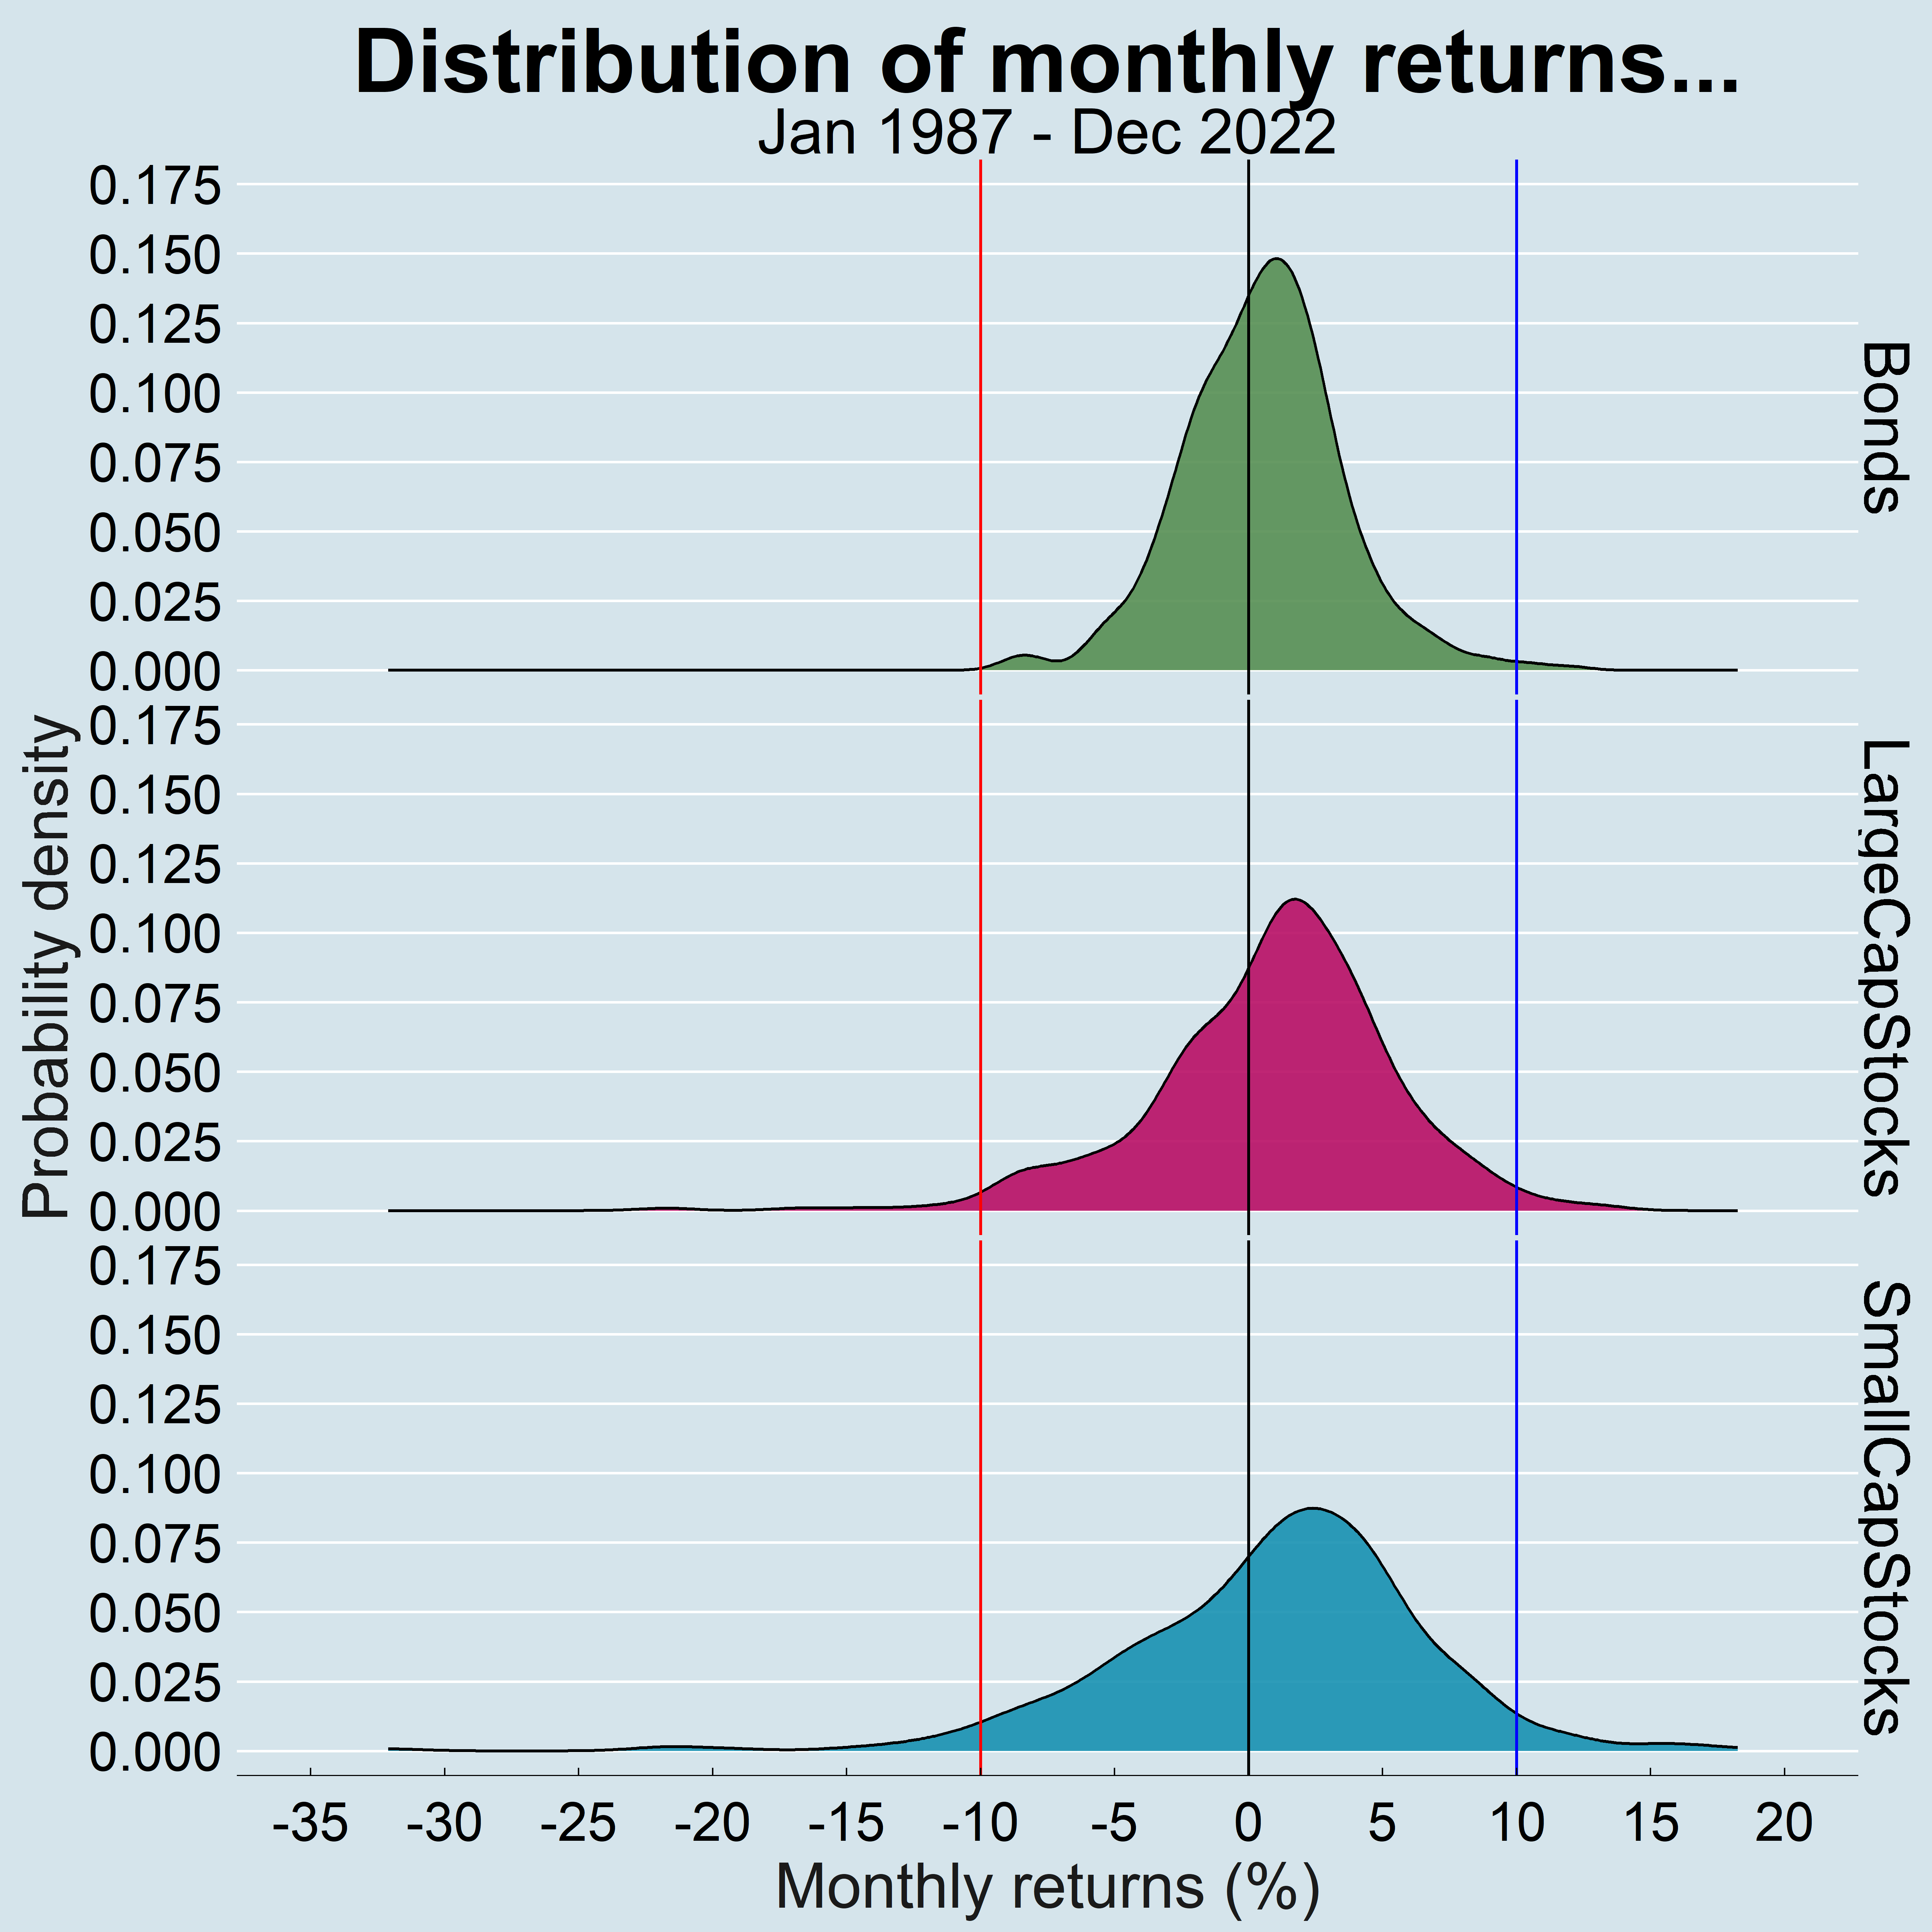
    And this is how the three investments behaved.

    Probability density tells us the proportion of months out of the total months where returns varied between any two ranges. Take the sub-plot for bonds for example. We can state by eyeballing it that for about 60 percent of the months, the monthly returns were between zero and 10 percent. In fact, we can make that claim for all three categories of investment.

    I show three vertical lines for each sub-plot: at zero percent in black, at -10 percent in red and at +10 percent in blue. A few observations…

    • You know that if you bought and held any of these investments from the start of the period to the end, you made money. And in some cases, a good chunk of money. How do we know that without doing any number-crunching? By estimating the area under the curves for each investment that fall to the right of the black dividing line that marks the zero percent line. The area under the curve for each one of them is greater to the right of that line than to the left. That means that at any given time, your returns were more positive than negative and that compounding over months and years is what gets you to that good chunk of money.
    • As you go down the plot from bonds to small cap stocks, the distribution of returns gets wider and flatter. Bonds have the tightest distribution; small cap stocks have the widest and flattest distribution. What does that mean? An increasing level of volatility as the distribution gets flatter. Some use volatility and risk interchangeably but volatility is not really risk as broad-based asset classes don’t go to zero. That is not true with individual securities. Bonds have the tightest distribution which in statistical terms means the smallest standard deviation (volatility). Small cap stocks, on the other hand, have the widest distribution and hence are considerably more volatile than bonds.
    • It is not as apparent but if you were to observe the peaks to the right of the zero-marker black line for each sub-plot, the peaks drift a little farther away from that line for stocks as compared to that for bonds. That implies that on average, monthly returns for stocks were higher than for bonds. Again, nothing pathbreaking, just one more observation.

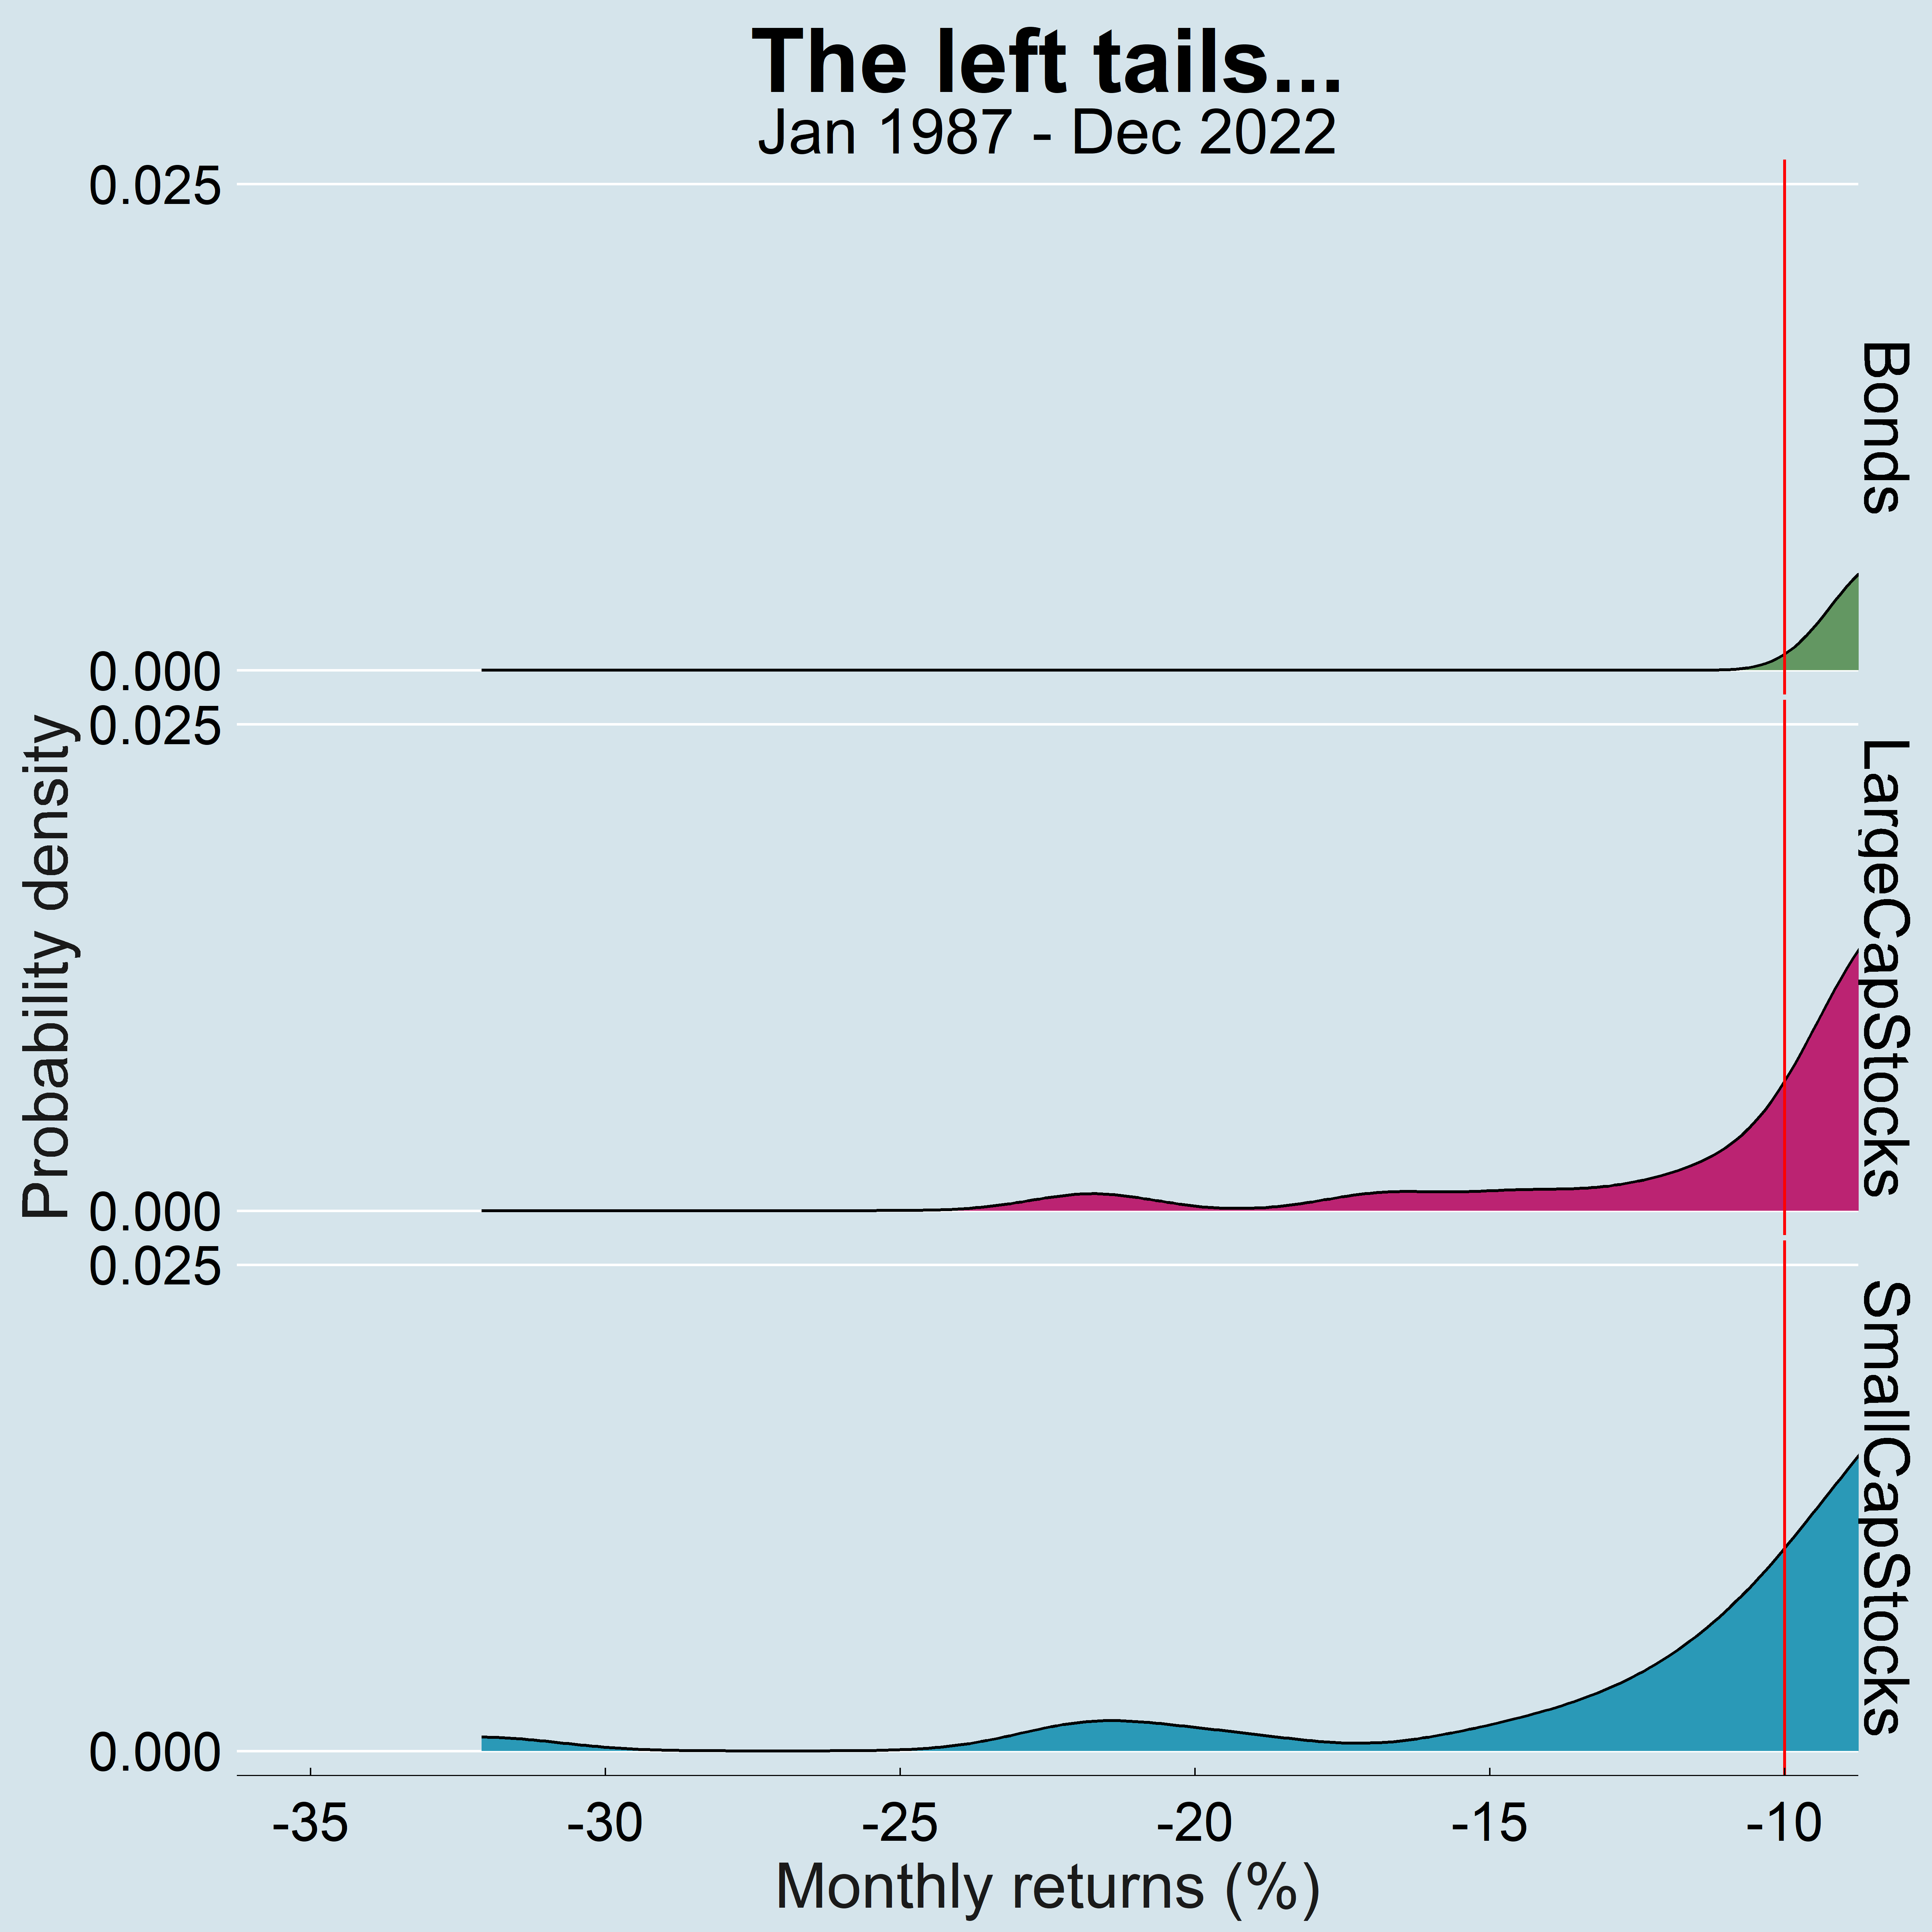
    Most mistakes happen in the tails…

    Then there are those long tails and specifically the left tails below the -10 percent line. The tails are visible for stocks but not noticeably visible for bonds. So, zooming in…

    Bonds had virtually no instance where you suffered a monthly decline of more than 10 percent.

    That is not true for stocks. Of all the months (432 in total), you’d have to endure a monthly decline of more than 10 percent for large cap stocks six different times.

    The worst monthly decline for large cap stocks was -22% in 1987. For those who know, that month includes the ominous Black Monday. The rest of the “bad” months happened during major market panics caused by events like the Asian financial crisis, the Dot-com tech crash, the banking crisis of 2008 and of course, the Covid pandemic.

    These “bad” events are what forms the left-tails in the plot above. And that is where the gravest of all mistakes happens. No one panic sells during the right-tail months, also called the “good” months.

    But if you have a plan and a conviction to act, the “bad” months in fact are the best months to invest new money. And the “good” months quite naturally are the worst. You are buying future cash flows (dividends). You should be euphoric when you get to buy the same amount of cash flows at 20 and 30 percent discounts.

    Bull markets begin with the feeling that the market can only go lower. Bear markets begin with the feeling that the market can only go higher.

    Peter Atwater

    Back to the data, things get a bit wilder with small company stocks where you’d have to endure 14 separate monthly declines of more than 10 percent. That is more than double the number of months for large cap stocks. There was even a month in the year 1987 when small company stocks declined by a good 32 percent. That is in a single month. Imagine waking up a month later with a third less money?

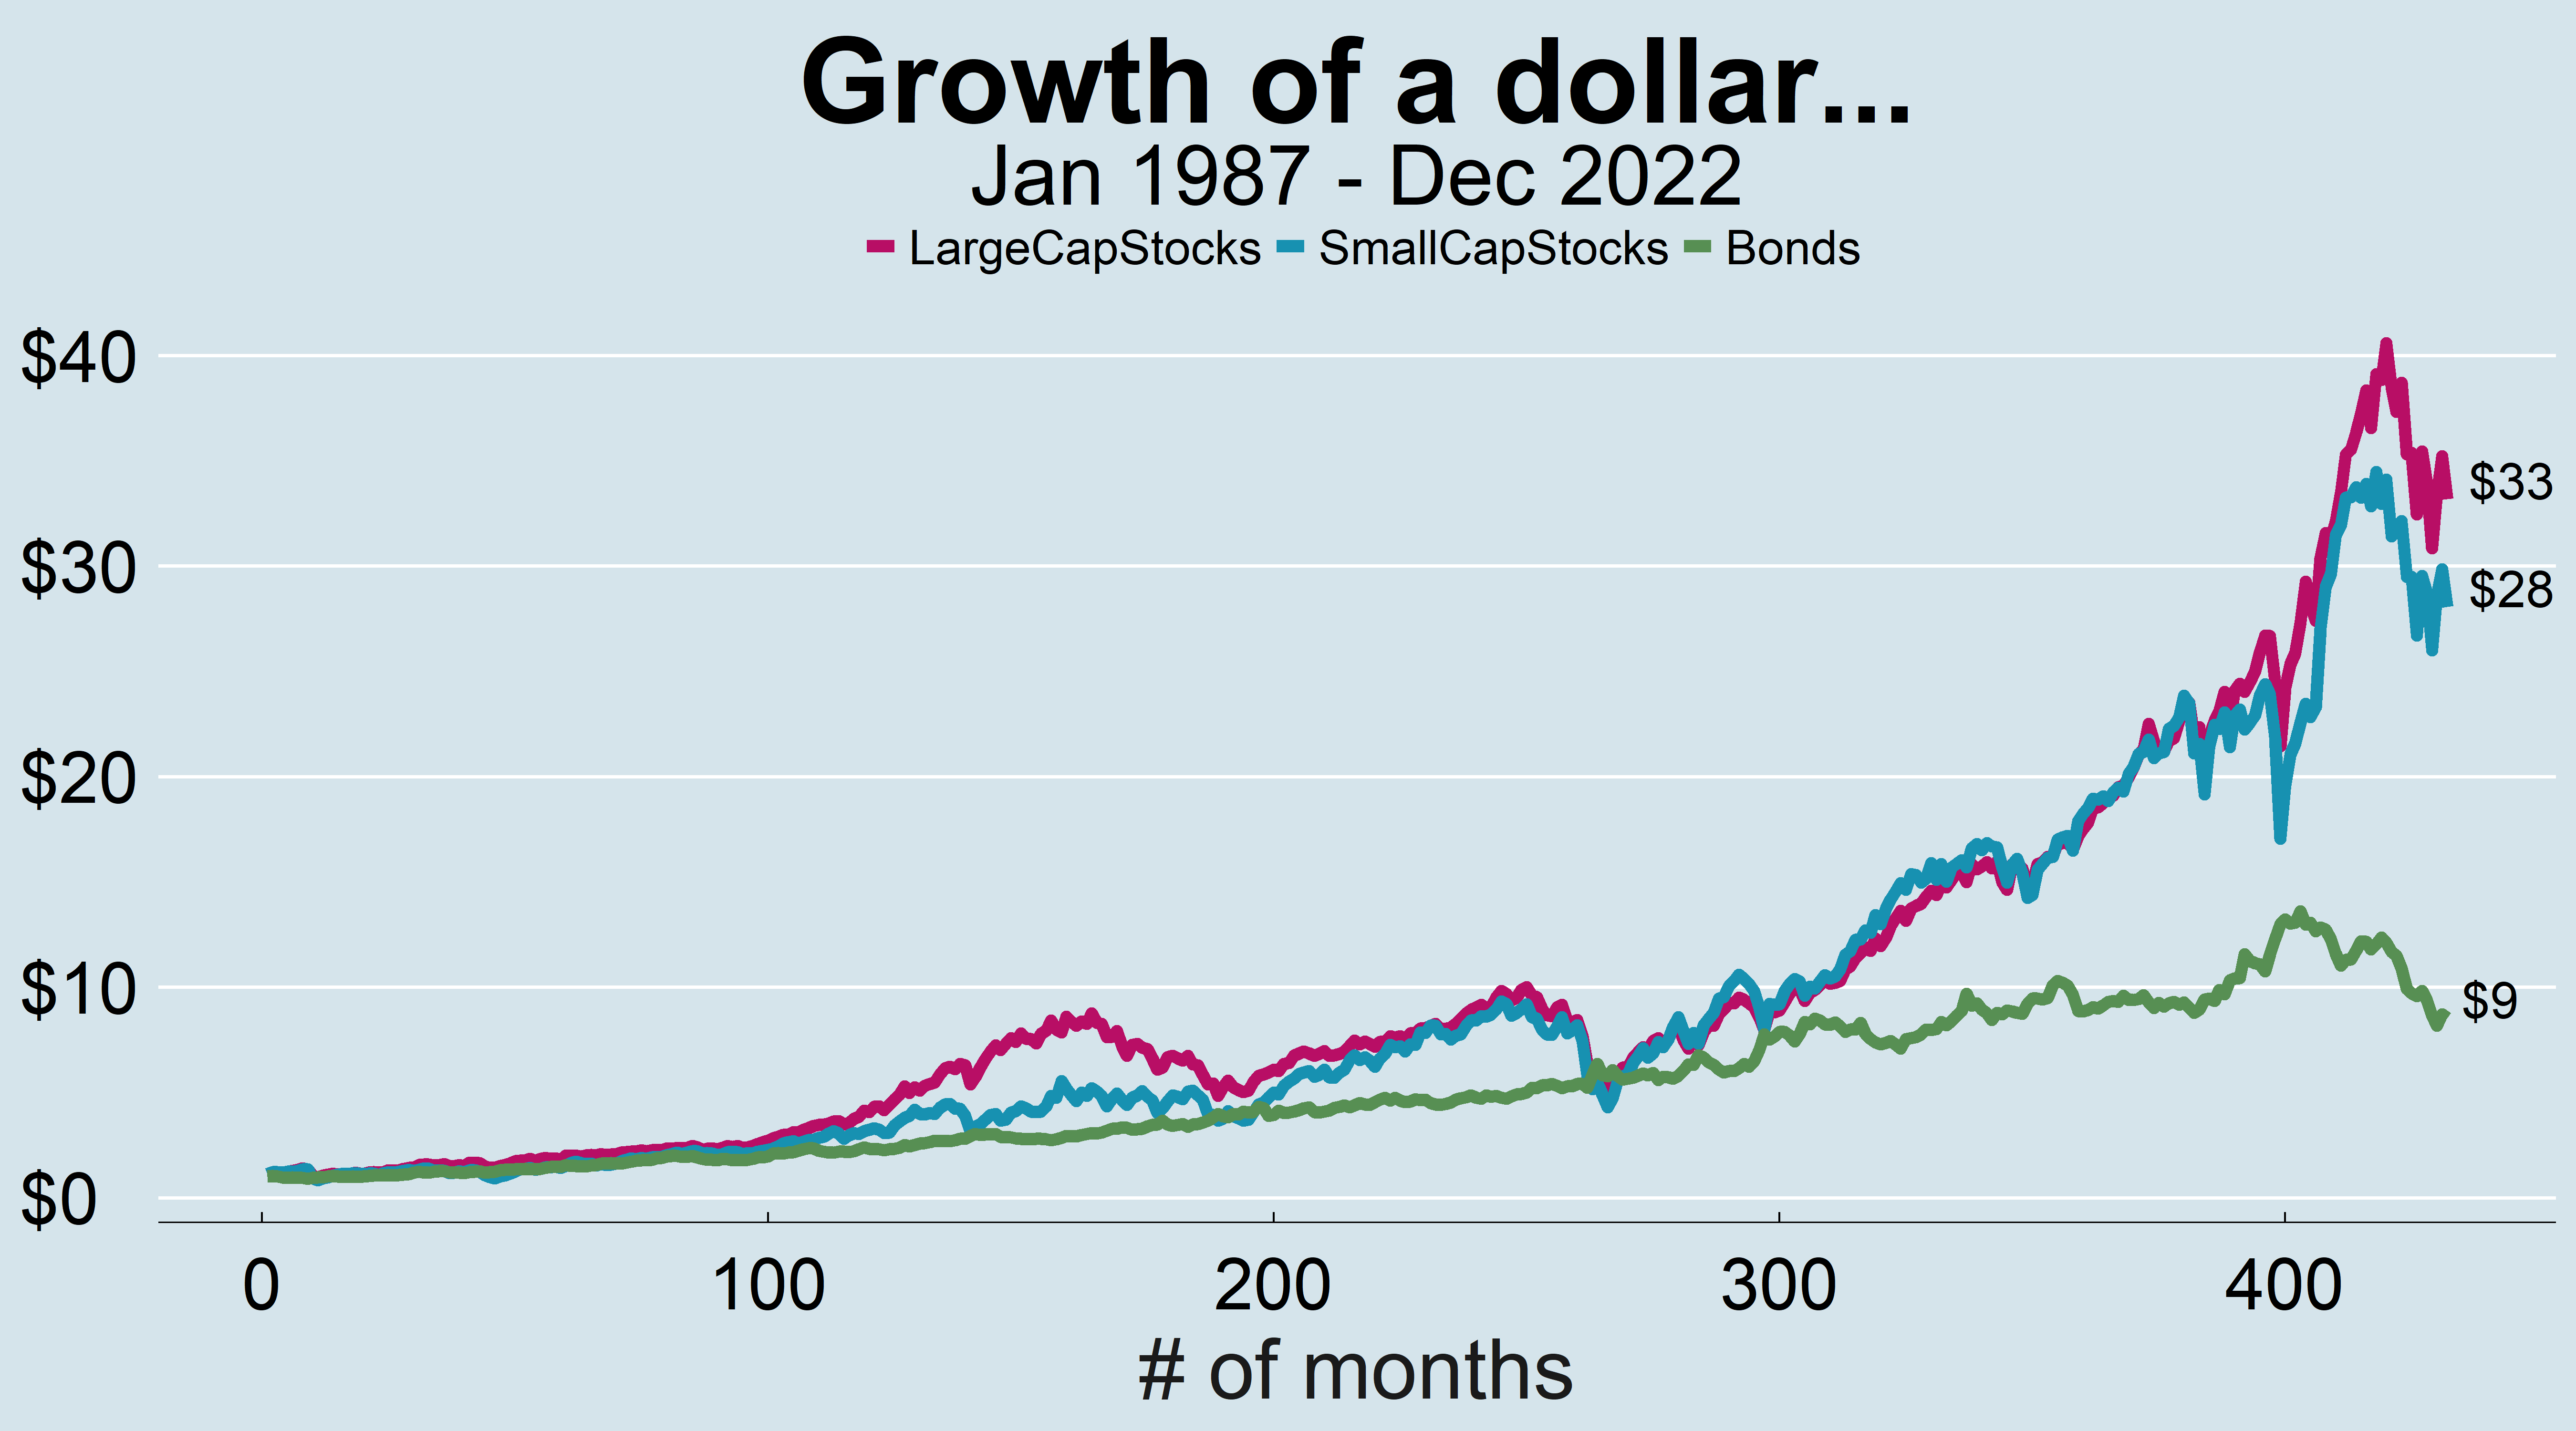
    The natural question then is that you’d have made more money investing in small cap stocks, right?

    Well, no. You made more money in stocks than bonds and that was expected. But you made less money with small cap stocks than with large cap stocks. That is even after taking all that risk. Isn’t that interesting?

    So, does that mean we abandon small cap stocks? No. What this means is that we don’t have a way to predict what an investment will do in any given cycle. And we don’t know when those cycles will turn. We just have to wait for them to turn.

    This discussion as always comes down to the process. If you have the right process built around a good financial plan, you just have to accept the occasional vicissitudes of the markets and invest away.

    Thank you for your time.

    Cover image credit – Anete Lusina, Pexels

  • Price vs. Value

    Price vs. Value

    Ralph Wagner, the legendary manager of the Acorn Fund, once likened the stock market to an excitable dog on a long leash in New York City, darting randomly in every direction. The dog’s owner is walking from Columbus Circle through Central Park to the Metropolitan Museum. At any given moment though, there is no predicting which way the dog will lurch, but we know that directionally, the dog is headed northeast because that is where the owner wants to go.

    Casual observers, though, trying to gauge which way both the dog and the owner are headed, will have their eye on the dog instead of on the owner.

    If you missed Mr. Wagner‘s analogy, the stock market is that excitable dog while the value of the underlying businesses resembles the owner. The stock market reflects the collective prices of businesses at any given moment and as we know, stock prices are volatile.

    And they’ll remain volatile because the stock market is trying to decide on the right price for a business based on the profits that business generates today and is going to generate long into the future. Imagine trying to predict profits for a business many years and decades down the road. Not that easy.

    And not just that, the prevailing and future interest rates also play a role because they dictate the discount rate. And discount rate is what gets used to discount those future profits and bring them back into the present.

    The aggregate value of all those future profits, once brought back to the present, is what makes up the fair value for a business (stock). More reading here if interested.

    And millions of market participants, knowingly or unknowingly, duke it out each day in the stock market to arrive at the fair value for a business. Every new piece of information that changes the trajectory of those profits or those of the discount rates gets immediately reflected into a stock’s price so again, volatility will remain an inherent component of a stock market’s life.

    But over the long haul and as Mr. Wagner was implying, the value of a portfolio populated with a healthy serving of diversified businesses will rise. It must rise because dividends, stock buybacks (indirect form of dividends) and the reinvestment of profits back into those businesses provides that perpetual upward lift to the value of that portfolio.

    Benjamin Graham, the father of value investing, once explained this by stating that in the short run, the stock market is a voting machine, tallying up which firms are popular and unpopular. But in the long run, the stock market is a weighing machine, assessing the true substance of a company.

    A roundabout way of saying that is that in the short run, stock prices can get stupidly volatile, both on the upside and on the downside. But that doesn’t and shouldn’t change the long-run value of a ‘good’ business.

    How do we know if we own a long-run ‘good’ business? We don’t. We can hypothesize and create all sorts of scenarios that reduces the odds of ending up with a lousy business but then a totally unexpected event turns a perfectly fine business upside down, a business that has weathered pandemics and World Wars, a business that has survived recessions and depressions, a business that lasted for more than a century of everything the world can throw at it, can still go belly up overnight aka Lehman Brothers.

    Or Bear Stearns.

    Or a blue-chip business that steadily declines over decades like Sears.

    Or Xerox.

    You say Xerox? I saw that coming.

    Not really.

    Xerox was the Google of its time. Palo Alto Research Center or PARC, a subsidiary of Xerox, was in large part responsible for breakthroughs such as laser printing, ethernet, the personal computer (imagine that), the graphical user interface, the computer mouse and many other technologies that literally changed our lives.

    And you had every right to be a believer in that company and continue to remain a shareholder but if that was all you owned or if that was a big chunk of what you owned, you lost a bunch.

    And hence we diversify.

    Owning ten different businesses in the same sector is not diversification. Because entire sectors can disappear or be left in a lurch for a long time. We don’t want to end up owning the next generation’s buggy whip and leather industries.

    And when we are building a 50-year financial plan, we have to make certain assumptions, and those assumptions should revolve around investments that can survive that timespan. They sure are not going to be those few stocks we think will get the job done because concentrated portfolios seldom deliver over decades long timeframes.

    Portfolio design requires intentionality. We can’t just slap things together with a stock here and a bond there and hope things work out. An ideal first step is to start with a baseline financial plan and incorporate investments that serve the primary intent behind that plan. Each investment in our portfolio must have a job to do.

    And each investment in a portfolio should talk to other pieces in that portfolio. In fact, the many pieces should talk across accounts. Your 401(k) should talk to your partner’s 401(k) and your partner’s 401(k) should talk to your Roth IRA and so on. Compartmentalizing by account is never efficient. Some investments work better in tax-favored accounts like a 401(k) and others work better in taxable accounts.

    And we want to expose enough of our money towards the many pieces in our portfolio to make a difference. One or two percent exposure to an investment category is not going to matter even if it were to shoot the lights out.

    Getting the baseline structure right is key. And then building a process around how we maintain that structure as our lives evolve.

    Lasting money is an outcome of good financial planning. Money of course is not everything, but it buys some of the best things money buys – peace of mind, great lived experiences and above all, independence…independence to live a life on our own terms.

    Thank you for your time.

    Cover image credit – Dariusz Grosa, Pexels

  • A Bias Towards Inaction

    A Bias Towards Inaction

    A business makes capital allocation decisions such as expanding a factory or investing in new tech with the intent of recouping that investment over a timeframe that spans years and decades. Not all capital allocation decisions pan out but the process that is followed is with the intent of getting as high a return on investment as possible.

    And the capital that a business needs can come from the profits it generates and if that is deemed inadequate, it raises that capital from the stock and the bond markets. Raising capital from the stock market means selling pieces of the business to investors while raising capital from the bond market means borrowing money from investors.

    So, imagine a bank lending you money to help you buy your home and then turning around and asking for their money back the very next day? Banks of course can’t do that by law, but you see how absurd that sounds.

    So why should you approach the allocation of your savings any differently? Because structurally, you are making the same kind of capital allocation decision as a business, or a bank makes which is long-term, risk-optimized and goal-oriented.

    And just like how a business won’t expect a return on its investment right away, you shouldn’t either. Exchanging pieces of paper (trading your portfolio) with each other is not how you get rich.

    You get rich through long-term ownership of businesses while receiving a portion of the profits those businesses generate in the form of dividends and share buybacks while letting the businesses reinvest the profits that remain, back into their respective businesses. That last part by the way is where true magic happens, not just for you but also for society.

    We have it so good these days that we forget how far we have come in a mere span of a century where the poorest of the poor in most advanced economies live far richer lives than John D. Rockefeller, the richest man did in his times. He lived through life with no TV, no internet, no air-conditioning, no airplane travel, no mobile phones and not even penicillin1.

    Free-market capitalism through which entrepreneurs and businesses work to find new ways to profitably invest and reinvest into their businesses to serve their customers and ultimately their shareholders is what made widespread access to all these wonders possible. We want that machine to continue churning out the goods but that takes time and is not possible with a short-term mindset.

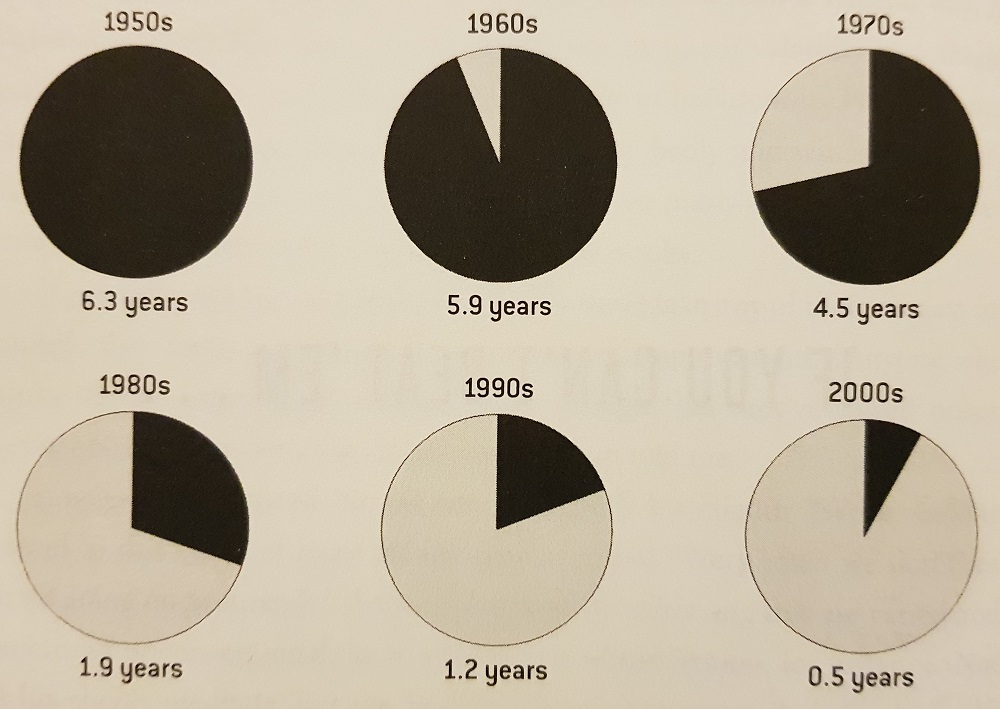
    But we are unfortunately hardwired to think only in the short term.

    Human nature desires quick results. There is a peculiar zest in making money quickly…compared with their predecessors, modern investors concentrate too much on annual, quarterly and even monthly valuations of what they hold, and on capital appreciation.

    John Maynard Keynes

    And the data proves it.

    Average Time U.S. Common Stock Was Held from
    The Signal and The Noise by Nate Silver

    Plus, the gamification of the investing process these days with instant access and micro-second level updates to what is happening to our money does not help. It incentivizes us to act thinking that doing something helps.

    But this bias towards action is poison to your money. And to the game of soccer. What?

    Michael Bar-Eli, et al. in a paper published in the Journal of Economic Psychology, highlights how this bias towards action amongst elite goalkeepers hurts a team’s chance with scoring goals. Soccer as we know is a low scoring game (about 2 goals on average) where a penalty kick is a big, big deal. A team that earns it has an 80 percent chance of scoring a goal.

    The stakes hence are high and pretty much all the burden of preventing a goal from being scored comes down to how the goalkeeper acts. The authors of the study analyzed data on 311 penalty kicks and found that the direction of the kicks was roughly evenly distributed between the left, center and the right quadrants of the goal box.

    But the goalkeepers displayed a distinct action bias by diving to the left or to the right 94 percent of the time instead of choosing to remain in the center. Because had the goalkeepers done that, they could have saved 60 percent of the kicks aimed at the center, a far higher number than they did by diving to the left or to the right. The goalkeepers however stayed in the center only 6 percent of the time.

    So, knowing that, why would they still dive rather than stand in the center? Because they wanted to appear as if they were making an effort even though making an effort was clearly disadvantageous.

    Similarly, this bias towards action in investing makes us feel better, thinking that at least we are making an effort. But that is precisely the wrong thing to do, and you are likely going to do that at precisely the worst possible times.

    Investing should be dull. It shouldn’t be exciting. Investing should be more like watching paint dry or watching grass grow. If you want excitement, take $800 and go to Las Vegas, although it is not easy to get rich in Las Vegas, at Churchill Downs, or at the local Merrill Lynch office.

    Paul Samuelson

    Your money is like a bar of soap – the more you handle it, the less you’ll have.

    Eugene Fama

    But that does not mean you don’t do nothing. There are still things that you have to get right, and they pertain more to learning how to not act than act. It is an evolutionary process that comes with time through continuous refinement until you get to a point where you are more likely to subtract and simplify than to add and complicate your money.

    The outcome of the process then becomes a three-stage exercise:

    • Defining a portfolio’s purpose that feeds different stages in your financial plan. Things like saving for college, buying a home, saving for financial independence come to mind.
    • Building a structure that supports that purpose through those life stages as you work towards your goals. This is where you decide the splits in your investment mix and how they evolve as your life evolves.
    • And only then, you go seeking investment products that fulfils that structure.

    You only mess with the last stage if the products you chose have drifted away from their intended role or if any aspect of the first or the second stages change.

    Let the rest of the world waste their lives chasing meme stocks and hot sectors. You work on getting the process right while refining at the margins and you’ll not only be at peace with your plan, but you’ll also be at peace with your work, your family and your life.

    Cover image credit – Kuiyibo Campos, Pexels

    David Henderson. “Richer than Rockefeller“, Econlib. February 8, 2018.

  • Sometimes, The Year You Retire Can Make A World Of Difference

    Sometimes, The Year You Retire Can Make A World Of Difference

    Let me introduce you to Jason. He retires in the year 1969 with today’s equivalent of a million dollars. That is, he retires with an amount of money that has the same purchasing power as what million dollars buys today.

    And he knows a thing or two about the ravages of inflation and hence, to preserve his purchasing power, he has his entire portfolio invested in the stock market.

    He has also heard about the 4% rule. That is, if he were to draw 4% from the starting value of his portfolio and adjust that amount in subsequent years to match inflation, he in theory would never run out of money for a 30-year planned retirement.

    Bella on the other hand, retires a year later (1970) with the same million dollars in purchasing power. Her retirement portfolio is invested just like that of Jason‘s in the stock market.

    And she expects to draw the same 4% from her portfolio and inflation-adjust that amount each year for the same 30-year retirement.

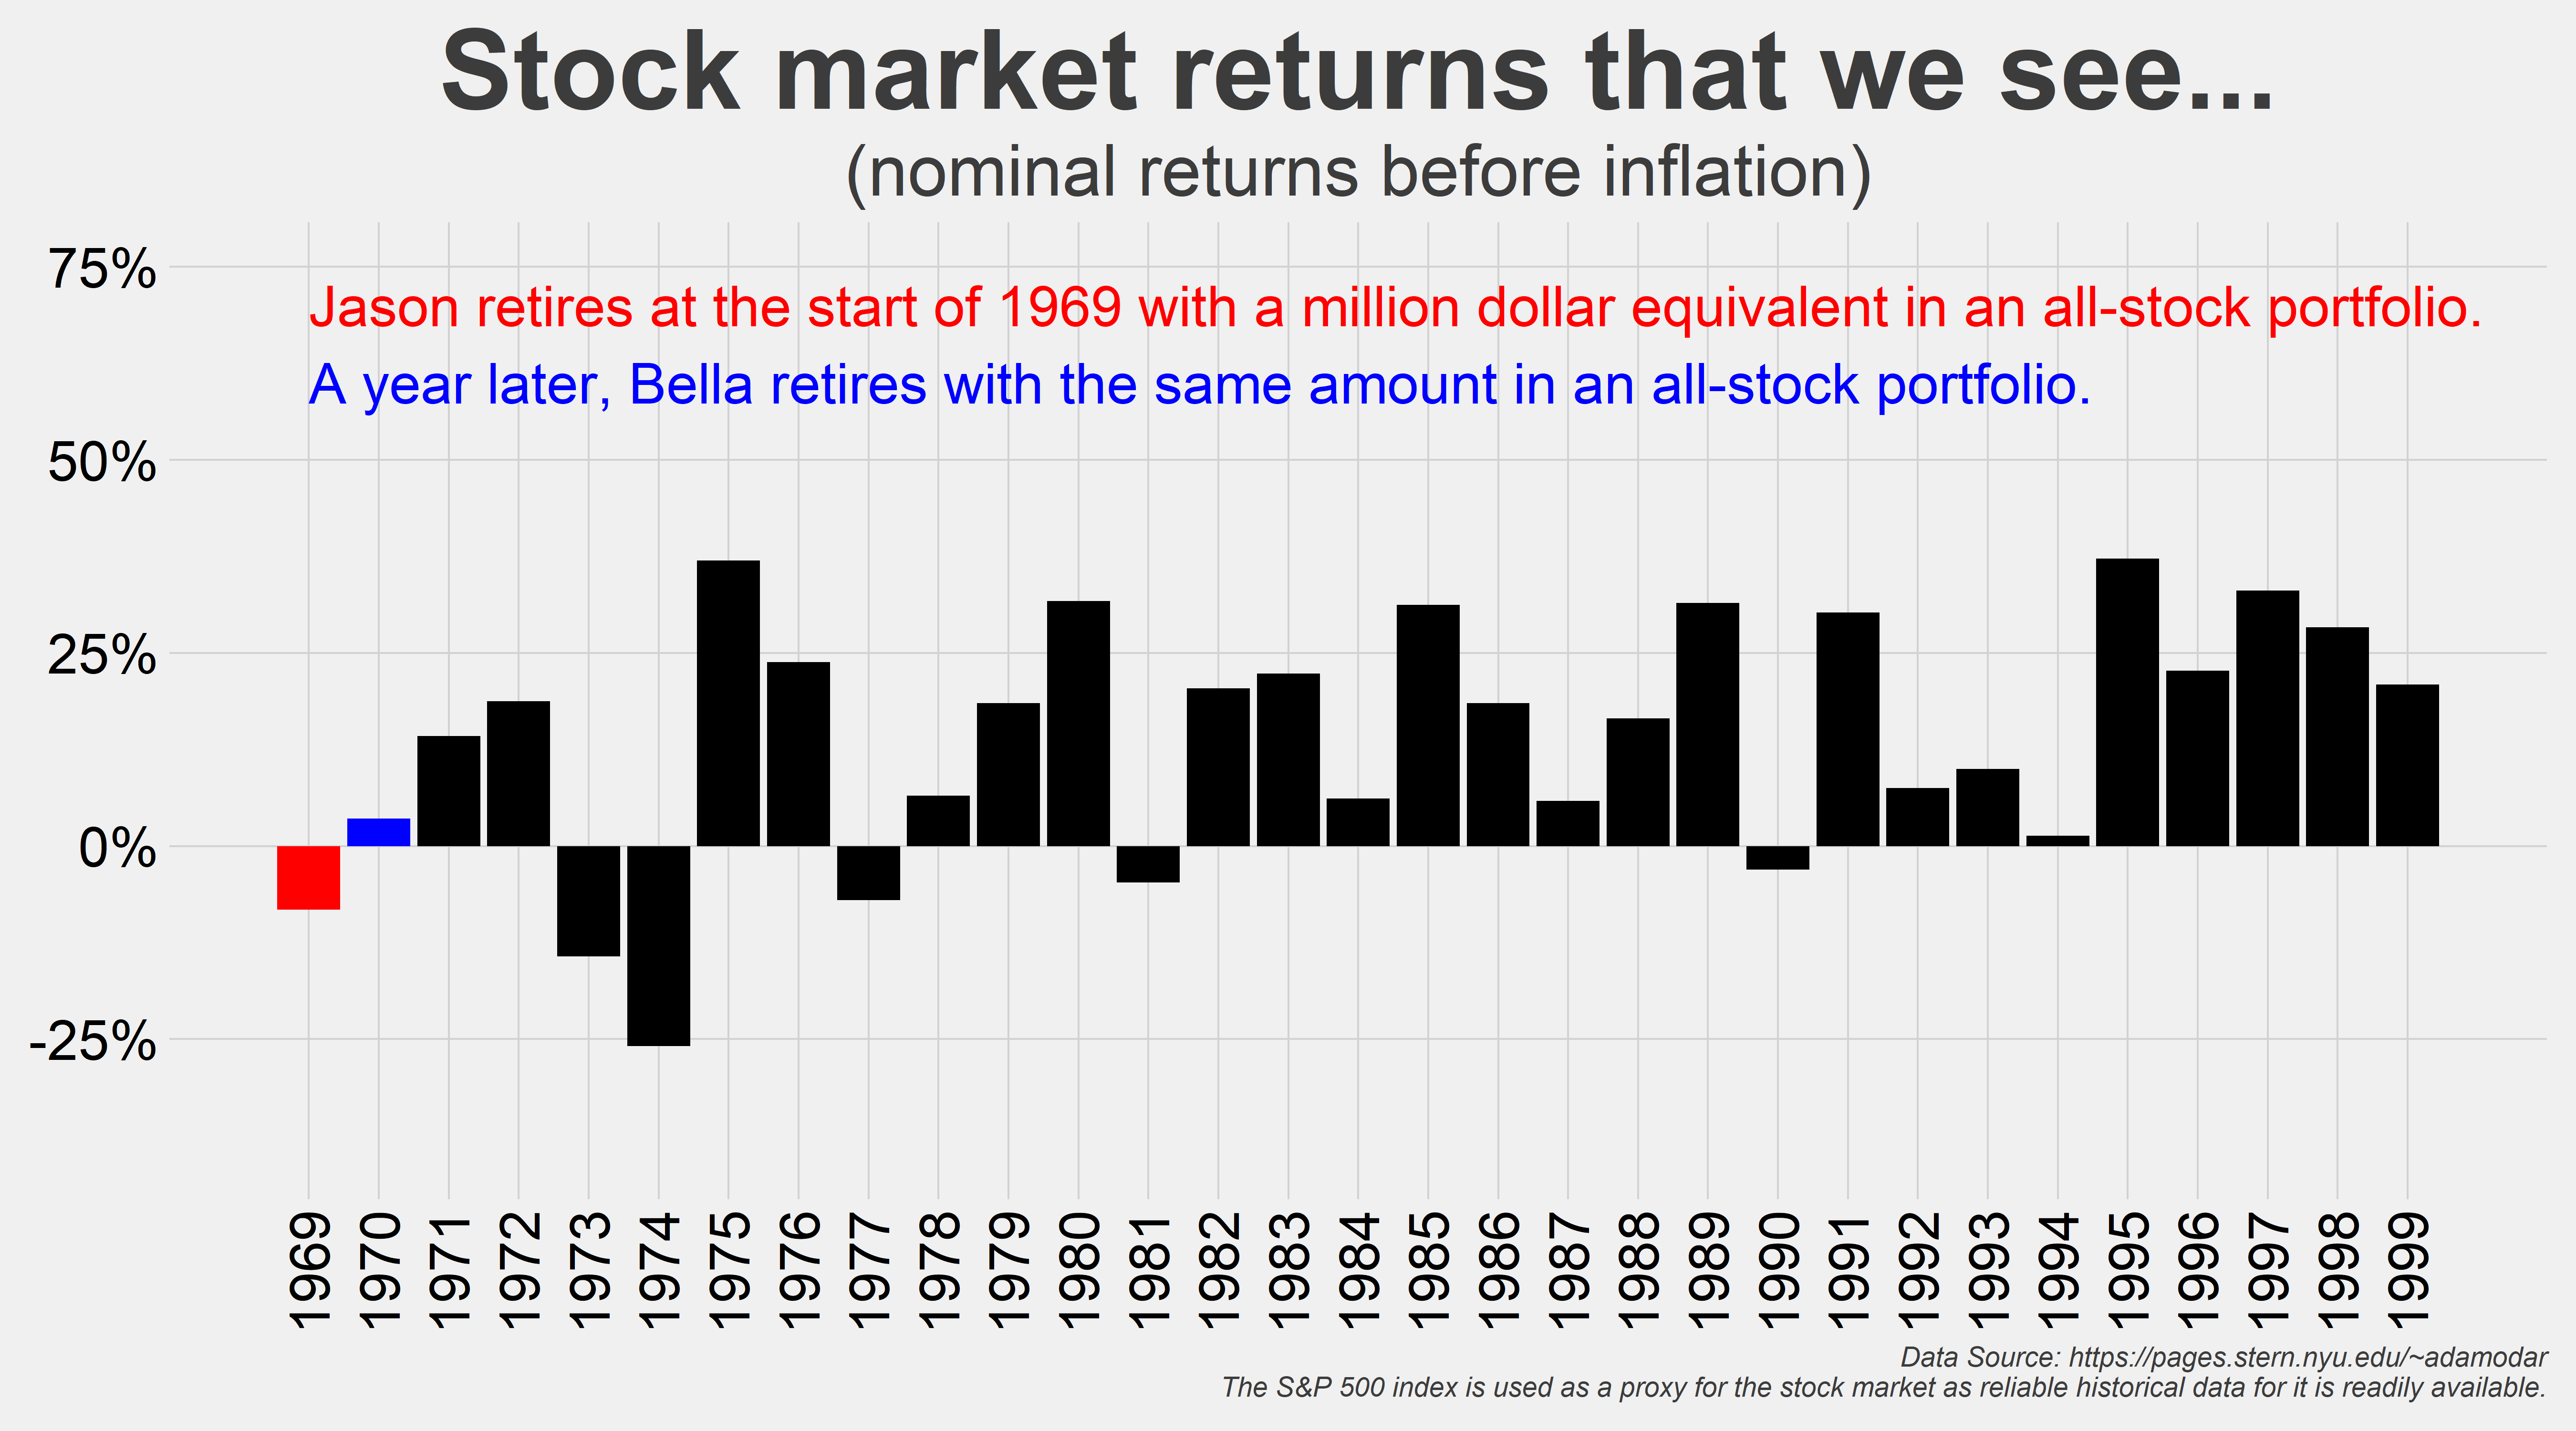
    These are the portfolio returns each one of them experience…

    Jason‘s retirement starts on January 1, 1969 and ends on December 31, 1998. That is a 30-year span of drawing inflation-adjusted income that we talked about.

    Bella retires on January 1, 1970 and is done retiring by December 31, 1999. That again is the same 30-year span of drawing inflation-adjusted income from her portfolio.

    So where is the problem? I mean you don’t expect to see much difference between the two scenarios, right?

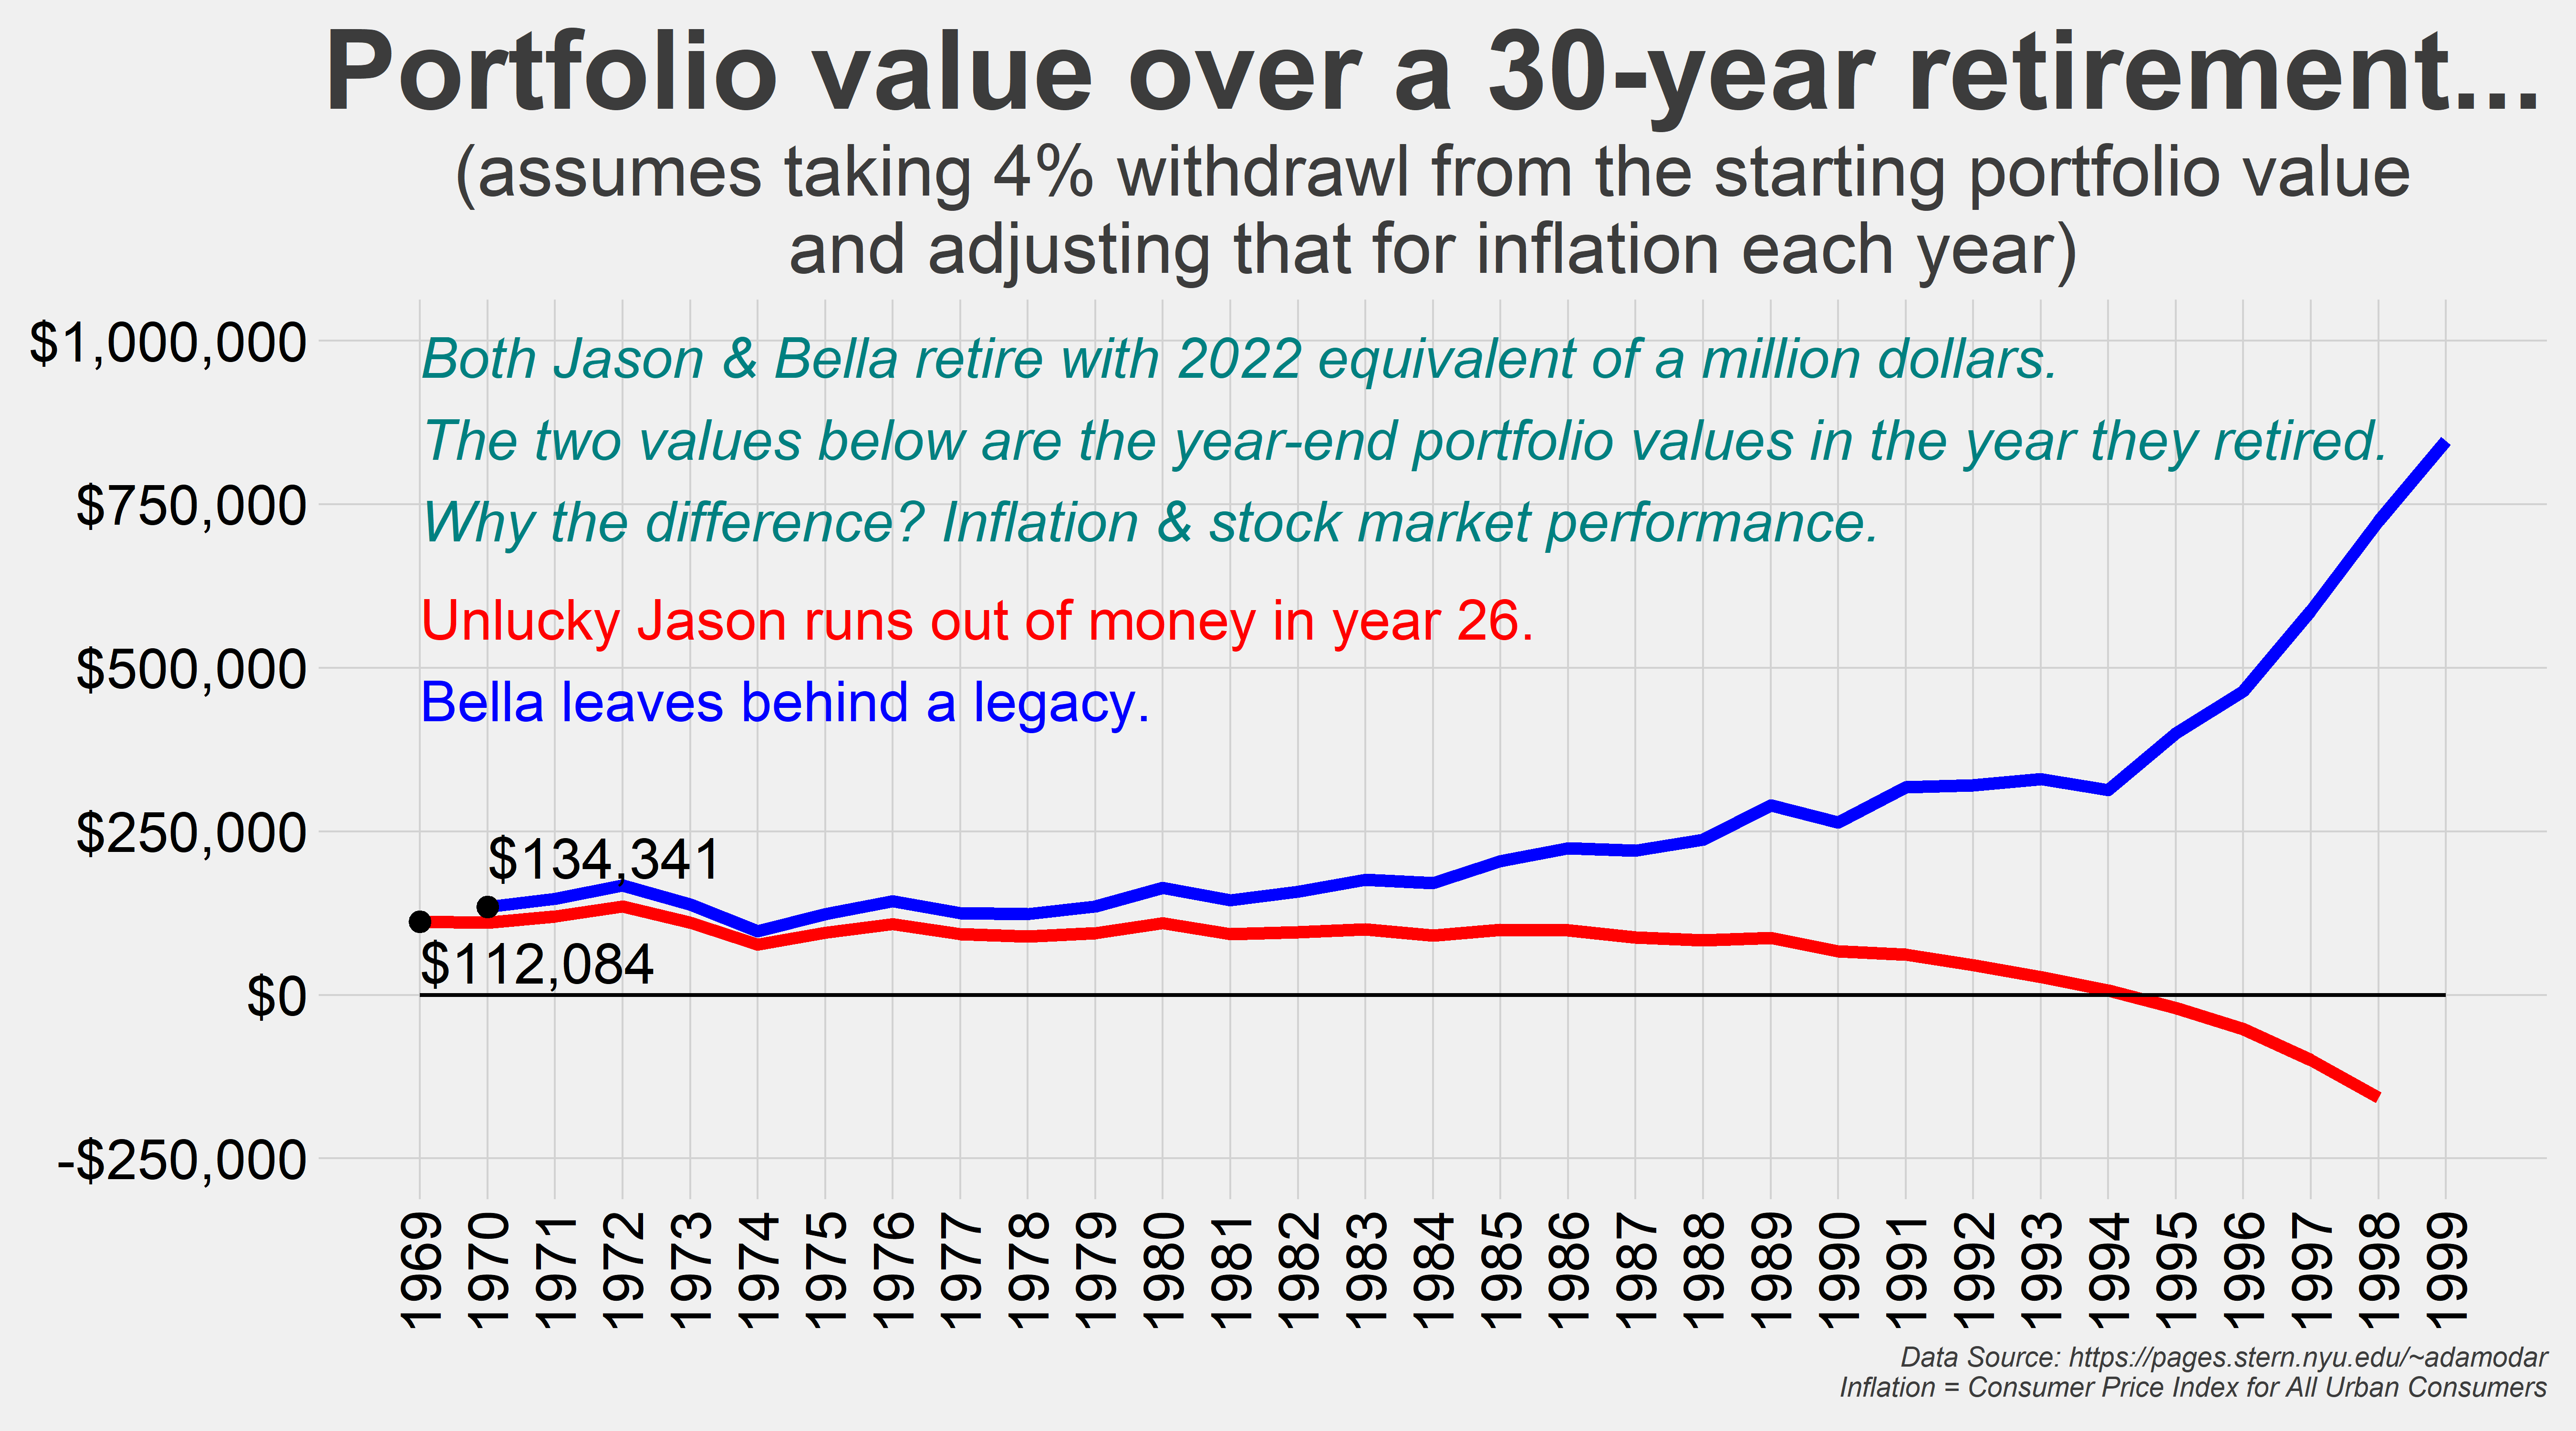
    But there happens to be a world of difference between the two. Jason exhausts his portfolio in year 26 of his planned 30-year retirement.

    Bella on the other hand leaves a sizable legacy behind.

    Maybe that was not her goal but the fact that her portfolio is able to deliver on the income she planned while leaving behind that kind of money is striking. And that is just because she retired a year later.

    And the money that Bella left behind is in 1999 dollars. If that money remained invested in the same portfolio, it would easily be multiple million today. Not that she gets to care though because she has longed since departed.

    So, what made all that difference? The starting year stock market performance combined with inflation.

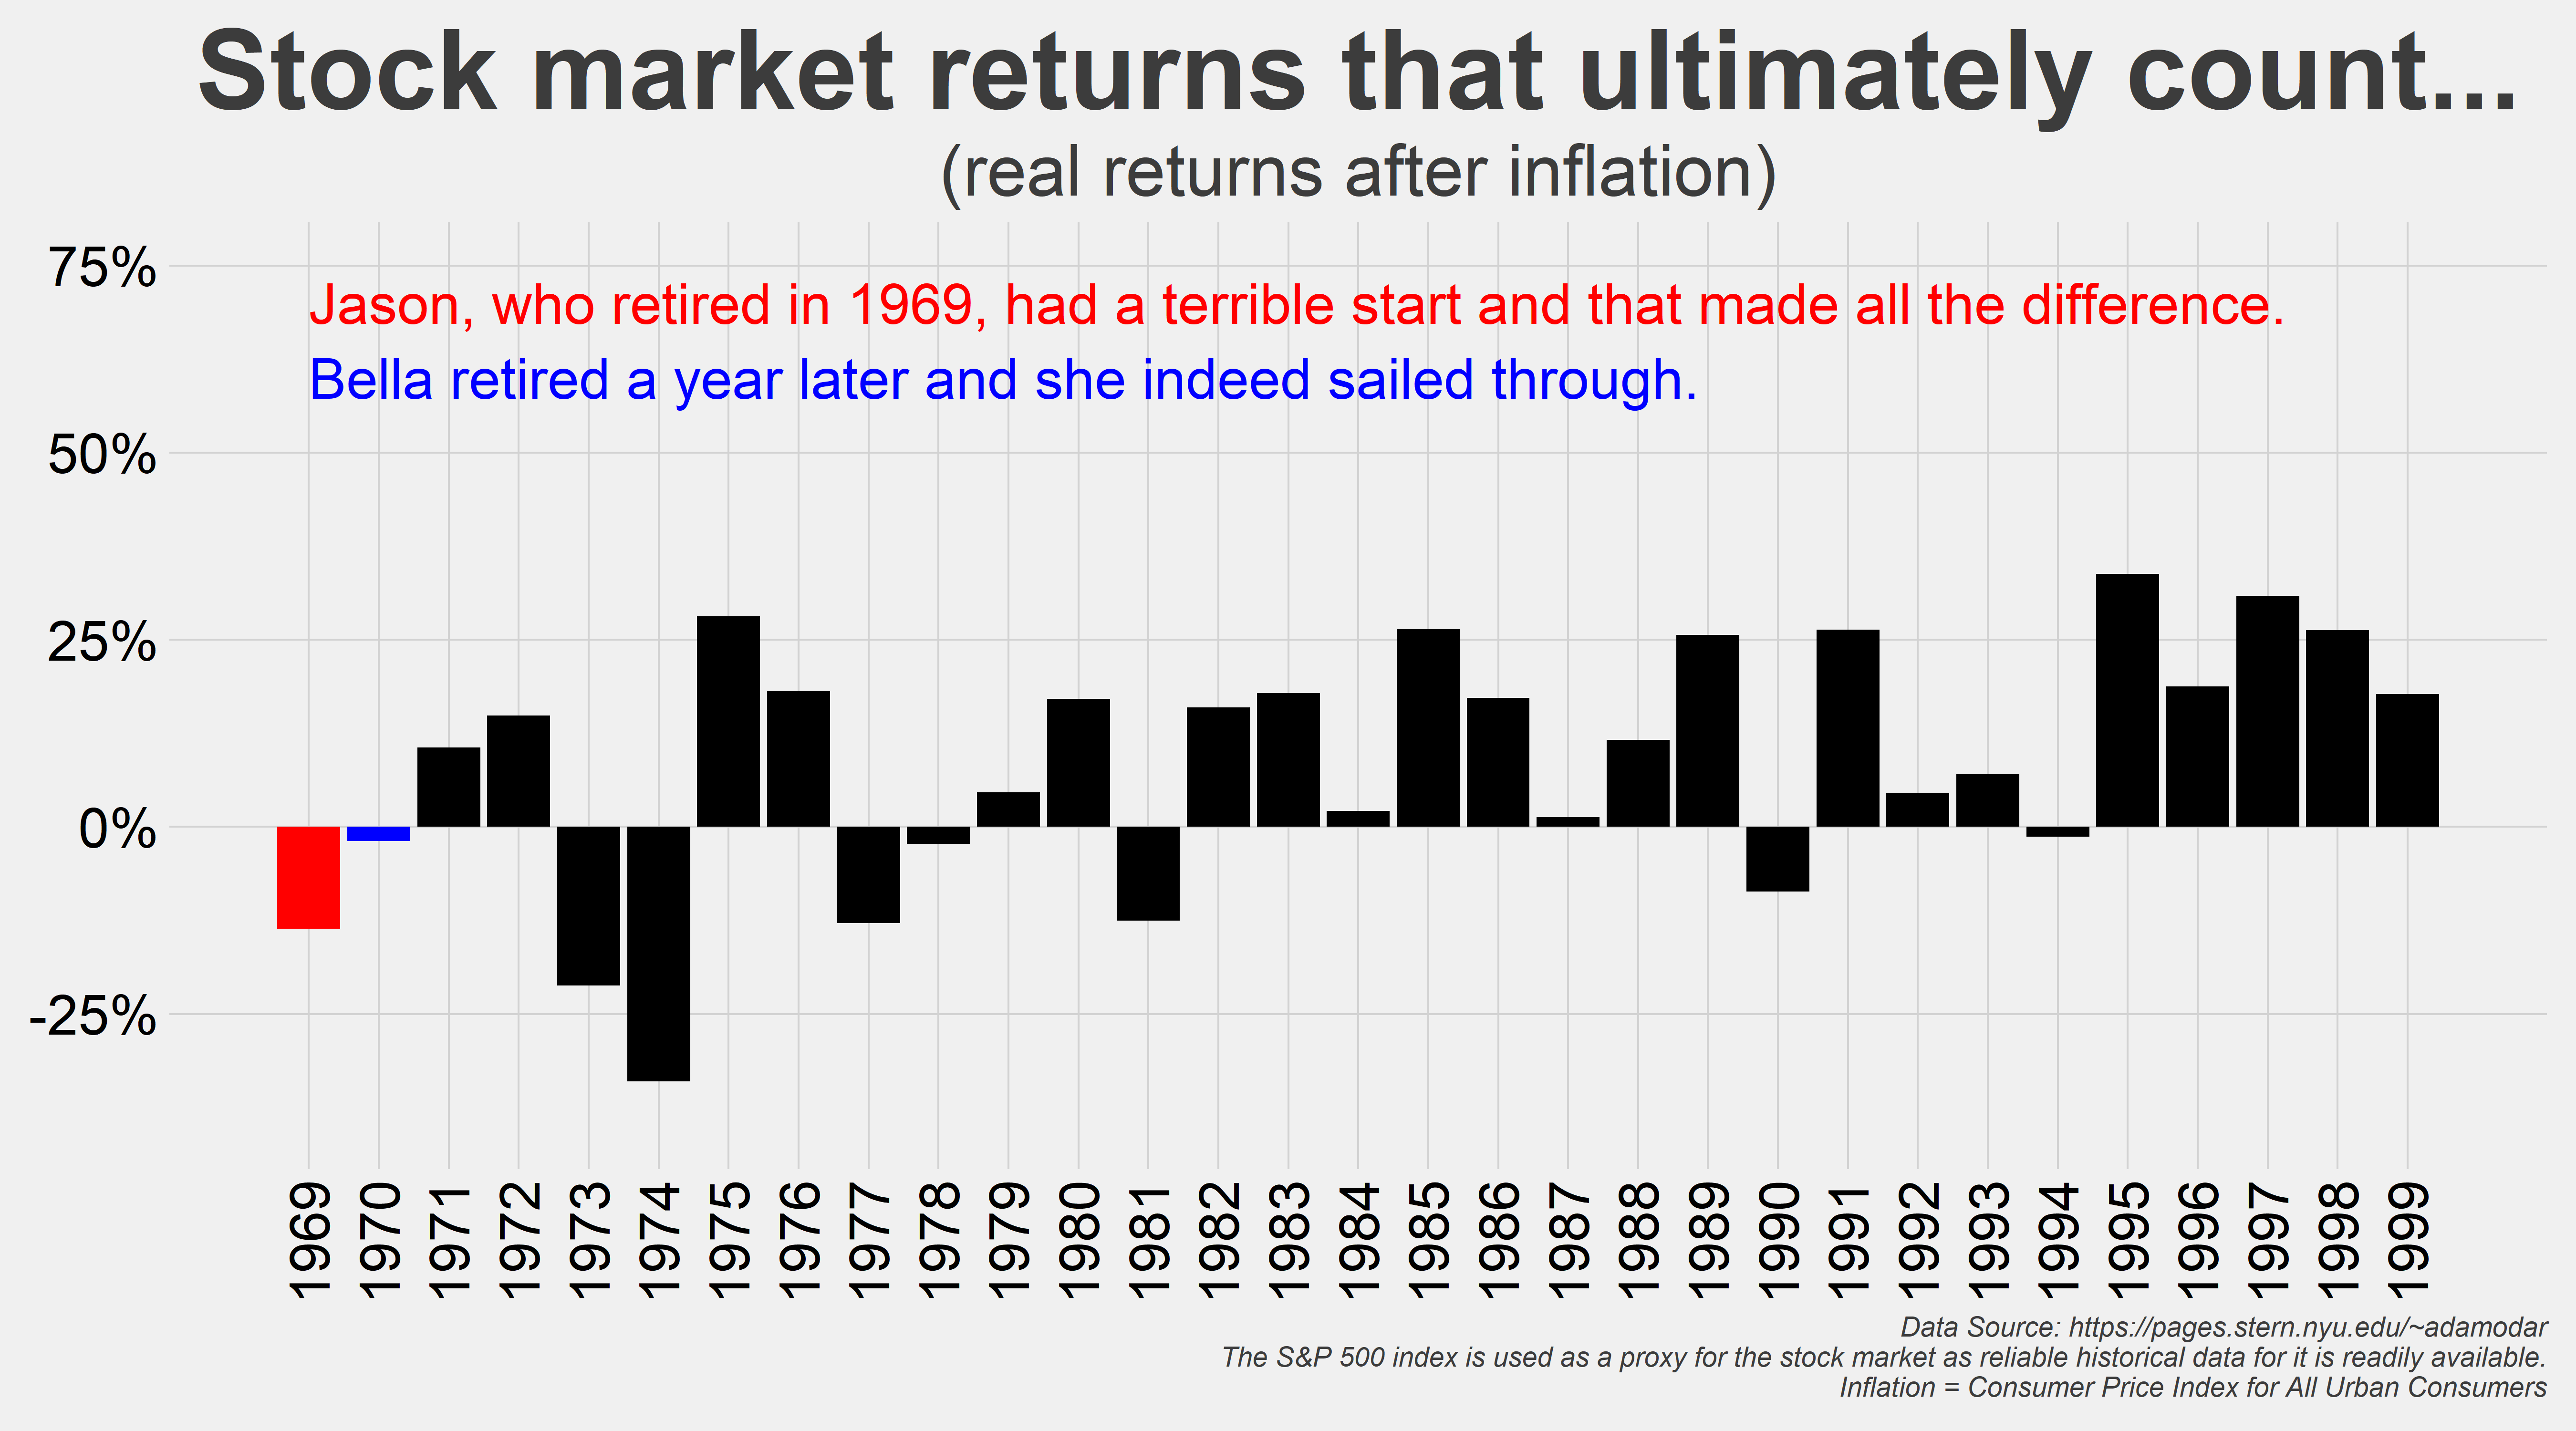
    The real, after inflation returns for both are as shown below…

    Jason‘s money took a big hit right off the gate while Bella‘s didn’t suffer as much. Jason, hence, was drawing income from a smaller portfolio value than that of Bella‘s and that made all the difference.

    Some takeaways hence…

    • Jason just got unlucky. Out of the 66 periods of 30 years each starting with 1928, there were only five such periods where one would have run out of money following the 4% guideline. And this timeframe accounts for literal world ending depressions and recessions, World Wars and oil embargos, inflationary and deflationary times, bubbles and busts and yet only five such periods. That is not to say that we should be complacent because future market returns could be lower but again, not as dire a situation as I probably made it sound.
    • Most retirement portfolios, as one nears the point to start drawing income, would not be holding all stocks. And even if they did, they would or should not be holding stocks in one market, exposed to one type of investment so the chances of a retirement outcome like that of Jason gets even slimmer.
    • No living soul that the world knows off will watch the inflation index and adjust his or her spending precisely in line with what the latest numbers show. I talked about this in the retirement spending smile because most normal earthlings won’t spend what they think they’ll spend when they are in the thick of their respective retirements. I am especially talking about the types that got this far reading stuff like this.
    • And if leaving behind a chunky legacy is your goal, you might want to ratchet down that safe withdrawal rate from 4% to say 3% of the portfolio’s value. If done right, this money at this new withdrawal rate will last forever and beyond.

    But then as life expectancies rise, 30-year retirements might feel short, especially if you retire early. I wouldn’t stress too much but it is good to crunch the numbers every once in a while to make sure you are on track. And a tad bit of conservativeness in your planning never hurts.

    Thank you for your time.

    Cover image credit – Ron Lach, Pexels

  • Positive-Sum Games

    Positive-Sum Games

    Say you decide to play blackjack with a friend, and you play to a point where one of you wins everything from the other.

    And say the game starts with $100 from you and another $100 from your friend and ends when either of you goes home with $200. The net wealth in the system (the game) started at $200 and ended at $200. The only thing that changed is how that money got divvied up.

    A concept from game theory, this is an example of a zero-sum game. For you to win, your friend must lose. For you to lose, your friend must win. The net wealth in the game though, remains unchanged.

    Each game of blackjack you play with your friend is a zero-sum game and say you play that game every day for five years. And assume each of you are equally skilled at that game. Some days you win, other days your friend wins but in the end, each of you will end up with the same amount of money you started with.

    And just like before, the net wealth in the system remains unchanged. This is a longer-term view of a zero-sum game.

    Playing blackjack at a casino is worse than a zero-sum game because now the casino wants its cut, and that cut is coming from you. So, what started as a zero-sum game is now a negative-sum game for you and a positive-sum game for the casino. It must be that way, or the casino won’t stay in business.

    So, if you win playing the casino, consider yourself lucky. But never mistake luck for skill because play there long enough and you’ll lose. That is by design.

    Playing the lotto is a big negative-sum game for you and a hugely positive-sum game for the state sponsoring that lotto.

    Trading in commodity futures, if you have no business trading in them, is another example of a zero-sum game. For someone to gain on a contract, another someone at the other end must lose. Take taxes and transaction costs into account and that seemingly zero-sum game quickly turns into a bigly negative-sum game.

    And if you don’t know what commodity futures are, you don’t ever need to know unless you are in the business of dealing with stuff that you’ll use in your business, and you need some certainty around that stuff’s future prices.

    For example, if you are running an airline, you might want to lock the price of oil say six months out by buying an oil futures contract. If you are not running an airline and you are trading in oil futures, don’t.

    What other negative-sum games do we play knowing full well that we are going to lose but this time around, we don’t mind? Life insurance.

    You buy a policy and pay premiums all along, but the worst-case scenario never happens. And you are glad it never happened. The insurance company facilitating this whole thing will take its cut but that is a good thing because when you buy life insurance, you are buying peace of mind. You are insuring your income for your family against you prematurely dying.

    Day trading stocks is another example of a zero-sum game before taxes and transaction costs and a big negative sum game after accounting for those costs.

    Then there is options trading on stocks and there are reasons for it to exist, but retail investors should never be allowed near that. It is a hugely negative-sum game after taxes and transaction costs with oftentimes tragic life changing consequences…

    Krurd, as it turns out, is a 35-year-old unmarried Chicago psychiatrist who had invested, and subsequently lost, nearly $1 million — all of his savings — in call options on Bill Ackman’s special-purpose acquisition company, Pershing Square Tontine Holdings, before it found a merger partner and inked a definitive agreement, or DA.

    How Millennial Investors Lost Millions on Bill Ackman’s SPAC
    Michelle Celarier, Institutional Investor, August 11, 2021

    $1 million at age 35 is all you need to be set for a fantastic retirement life. But now all gone in the blink of an eye.

    These men — and they all happen to be men — are immigrants, first-generation Americans, and children of the blue-collar working class who have excelled in their professions. They are now engineers, small-business owners, doctors, consultants. Some went to Harvard, Princeton, UCLA. Many were the first in their families to attend college; a few are still students.

    They are millennials — ranging in age from 24 to 39 — who live in New York, California, Illinois, Maine, Utah, and Texas, as well as Germany and Canada. They all lost money in Tontine — in at least one case more than $2 million — as SPAC mania swept through the stock market like wildfire over the past year.

    How Millennial Investors Lost Millions on Bill Ackman’s SPAC
    Michelle Celarier, Institutional Investor, August 11, 2021

    The write-up also talks about a 39-year-old software engineer who scrimped and saved $1.6 million over twenty long years and rightly afraid of losing any of it, kept it all in a bank account. Not the best of deals but worked for him because he did not know any better.

    And then lost it all on call options that expired worthless in a matter of days.

    But back to stocks, day trading them is the dumbest thing you could do with your money. Because stocks are not just little digits on your screen. They represent partial ownership in real businesses that make real products.

    I consider day trading as any activity that is short of perpetual ownership of businesses while you wait for the cash flows in the form of dividends to flow to you until that business has run its course.

    But owning one or two businesses entails the risk of those cash flows from ever materializing so you own a bunch of them. And then you sit tight and wait.

    The only positive-sum game hence, in the world of investing is long-term, perpetual ownership of businesses; businesses that power and feed our ever-growing economic pie; businesses that are run by some of the brightest of folks around; businesses with all their buildings and machines and processes working in unison to create the magic we see all around us. You’d want to forever own a piece of that magic.

    Thank you for your time.

    Cover image credit – Gladson Xavier, Pexels

  • The Retirement Spending Smile

    The Retirement Spending Smile

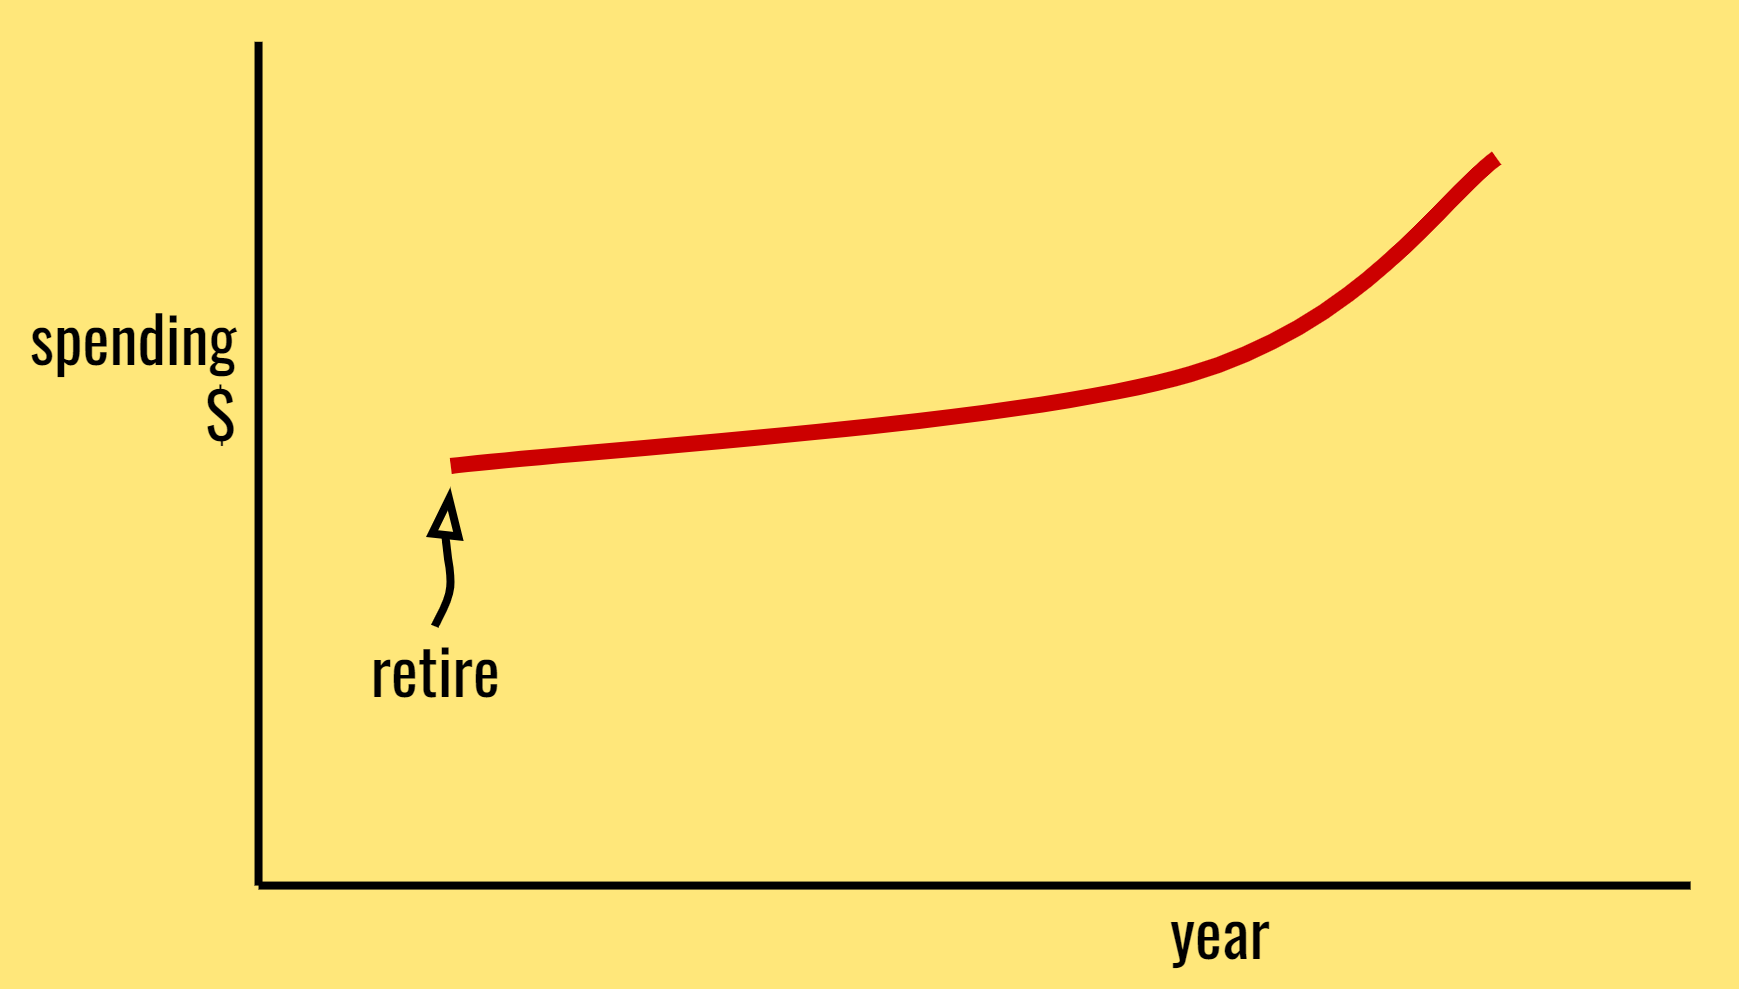
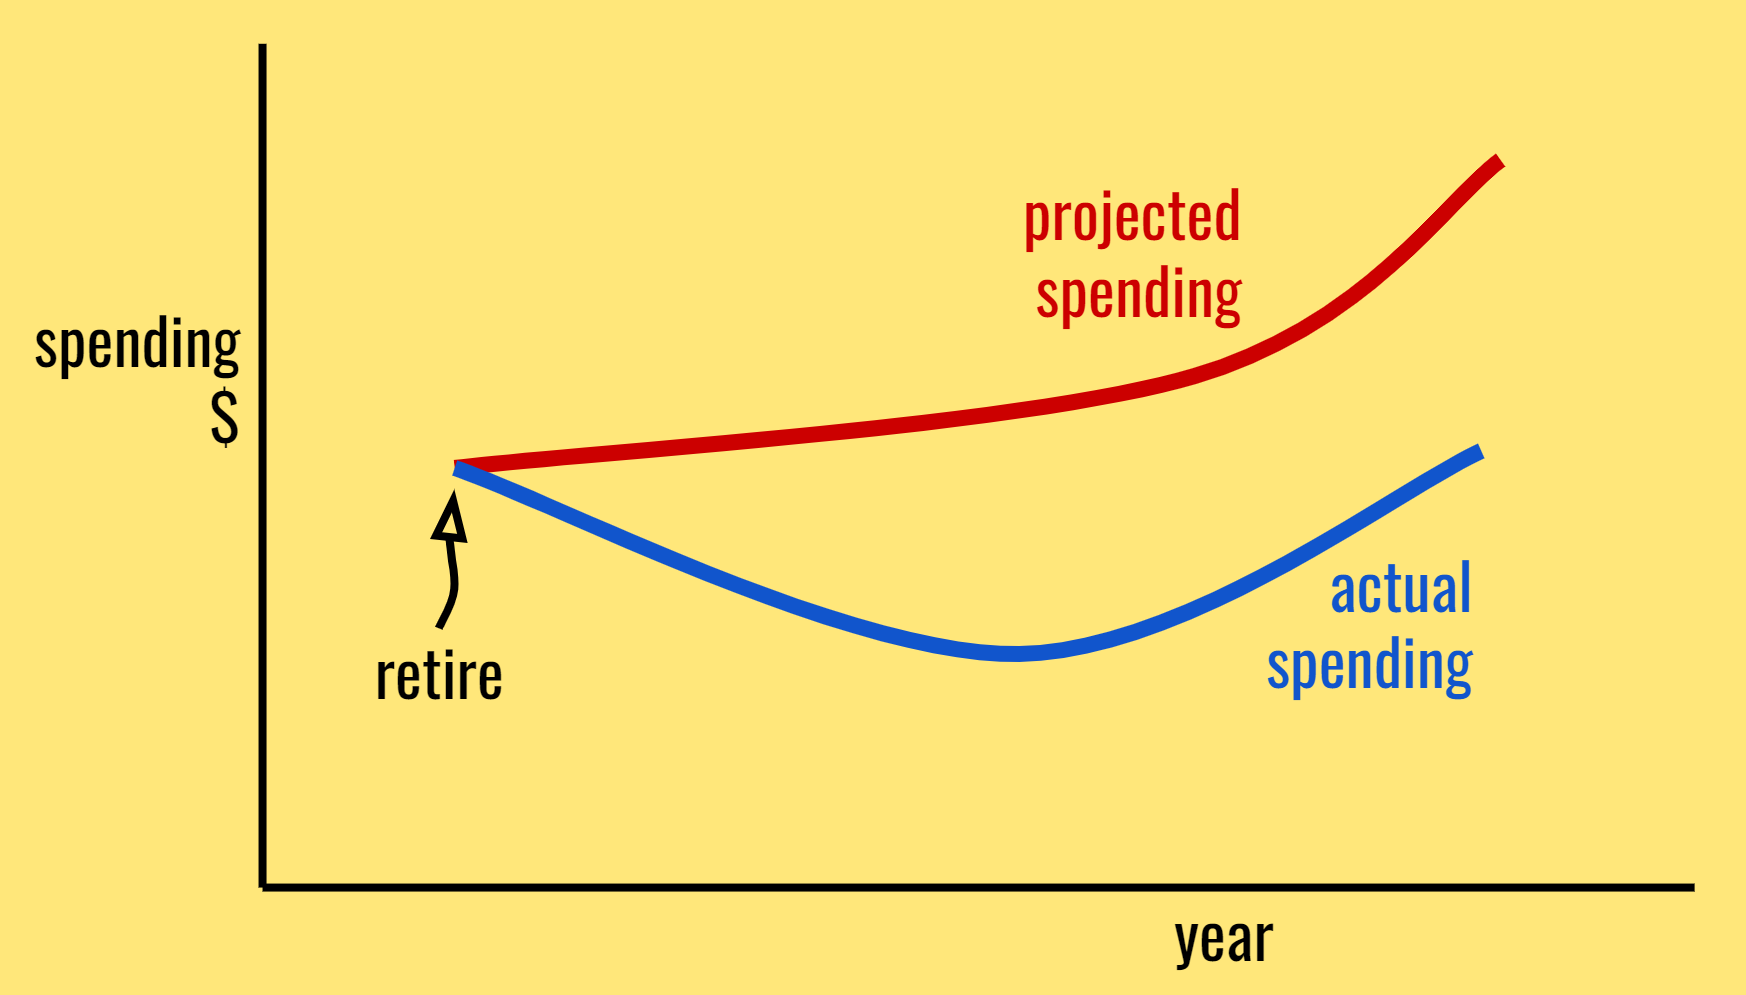
    You think you’ll spend like this…

    But instead, you spend like this…

    Retirement experts who’ve studied this say that we spend in three phases…

    • the go-go years,
    • the slow-go years,
    • and the no-go-years.

    The go-go years are your first set of years in retirement. You play, you travel, you spend.

    Then you start to slow down. Your spending naturally declines.

    And then you really slow down. But your spending rises as you start to spend more on healthcare.

    So, if you planned to spend like you thought you’ll spend, you should allow yourself to spend more.

    Because the money you don’t spend in the early years compounds and it can compound for decades into an enormous sum. Not the worst of things but then you can’t take it with you.

    But then who likes the word retirement? Financial independence sounds better – independence to do the best work of your life while you keep yourself engaged, active and relevant.

    I mean don’t quit working but quit the work that looks like work. And then mix in those interim all-deserving breaks. Travel, explore and continue discovering.

    Thank you for your time.

    Cover image credit – Kat Smith, Pexels